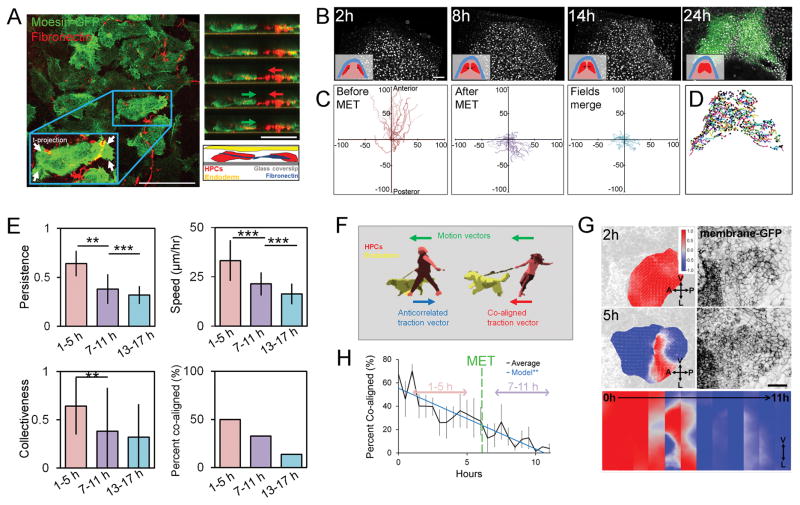
Figure 3. Heart progenitor cells undergo behavioral transition during stages of mesenchymal-to-epithelial transition.
(A) Left panel: heart progenitor cells isolated from the anterior lateral plate mesoderm show mediolaterally oriented bipolar lamellopodial protrustions (see arrows) that deform fibronectin fibrils (left). Right panel: HPCs extend protrusion, pull on fibronectin fibril (red arrow), and move forward (green arrow). (B) Intravital windowed embryos with fluorescently labeled nuclei reveal cell movements (inset shows tissue organization of ectoderm (blue), mesoderm (pink), and HPCs (red)). At 24 h, expression of nkx2.5-GFP transgene allows retrospective identification of HPC tracks (scale bar = 100 μm). (C) Spider diagrams of nuclei migration trajectories over 4 hour period. (D) Nkx-2.5-GFP identified HPC movements from start to end (black circle). (E) Persistence, speed and collectiveness of HPC movements before MET (1 to 5 h) are higher than after MET (7 to 11 and 13 to 17 h). N = 252 cells for 1 to 5 h, 216 for 7 to 11 h, 411 for 13 to 17 h pooled from 3 embryos from 3 different clutches. * indicates p < 0.05, ** indicates p < 0.01, *** indicates p < 0.001. (F) Schematic of traction force and motion correlation. (G) Correlation score between motion and bead displacement vectors on the left and membrane-MKO2 on the right. HPCs exhibit co-aligned motion and traction (+1, red) before transitioning to anticorrelated (−1, blue) (scale bar, 100 μm). Strip kymograph over 12 hour period (lower panel). (H) Percent of co-aligned HPCs decreases over MET (7 tissue isolates over 4 clutches, black; linear regression, blue; error bars, ± SEM). See also Movies S1 and S2.

