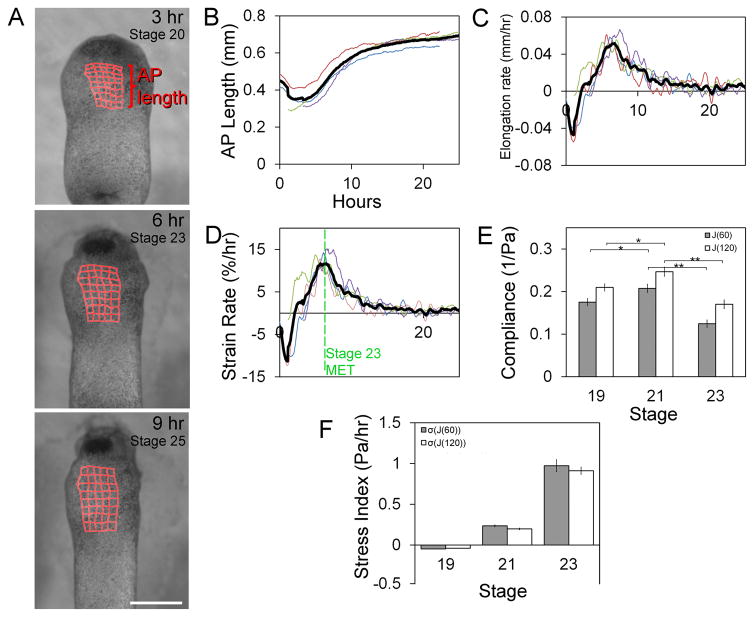
Figure 4. Peak stress in ventral heart forming region at stage 23.
(A) Frames from time-lapse of ventral regions over 24 hours with tissue deformations superimposed (red grids; scale bar = 500 μm). (B) Anterioposterior (AP) length, instantaneous elongation rate (C), and the strain rate (D) indicates non-linear growth (thick black line is average of 4 embryos). (E) Compliance of HFR from stage 19 to 23 including fast-response (J(60)) and steady-state (J(120)) responses. (F) Anterioposterior stress index (Pa/hr) calculated from compliance and strain rate (error bars, ± SEM; * indicates p < 0.05; ** indicates p < 0.01). See also Movie S3.

