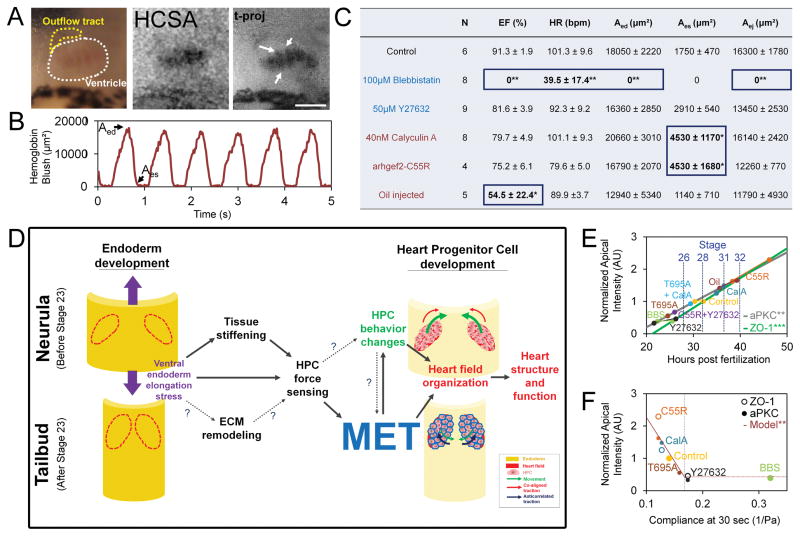
Figure 7. Specific lesions to larval heart function in response to MET perturbations.
(A) RGB image of 3-day old tadpole heart with ventricle outlined in white and outflow tract outlined in yellow. Hemoglobin contrast subtraction angiography (HCSA) and multi-frame, time-projection of HCSA over one cardiac cycle shows individual trabeculae (arrows; scale bar = 100 μm). (B) Time varying hemoglobin blush reveals typical cardiac cycle dynamics, with end-diastolic volume (Aed) and end-systolic volume (Aes) indicated on graph and table (C; pooled from 3 clutches; ejection fraction, EF; heart rate, HR; end-diastolic area, Aed; end-systolic area, Aes; area ejected, Aej). * indicates p < 0.05; ** indicates p < 0.01. Treatments increasing compliance (decreased cell contractility, blue) and treatments decreasing compliance (increased cell contractility) or stress (red). (D) Schematic of model of mechanical coupling between endoderm development, heart progenitor cell development, MET, and cardiogenesis. (E) Endogenous apical polarity increases over time (data redrawn from Figure 1F–I) and changes with mechanical perturbations at stage 28 (data redrawn from Figs. 2, 5, 6). Regression line (aPKC: y = 0.77t − 1.34; R2 = .446; ZO-1: y = 0.92t − 1.96; R2 = .567). (F) Apical polarity decreases with compliance (regression fit to data from arhgef2-C55R, calyculinA, control and Y27632 data (y = −27.22*J(60) + 4.99; R2 =.843). See also Figure S6D–H and Movie S6.

