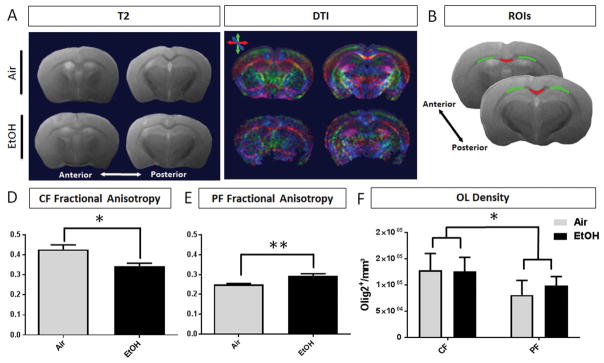
Figure 8.
MRI analysis at P50 shows microstructural changes in the white matter of EtOH brains compared to air controls. (A) Corresponding anterior and posterior T2 structural maps and directionally colored diffusion maps (green = dorsoventral, red = mediolateral, blue = rostrocaudal) of air and EtOH exposed animals. (B) Per brain, two slices were selected for quantification. Representative ROIs encompassing the callosal crossing fibers (CF, red) and projection fibers (PF, green). (C) At P50, the fractional anisotropy (FA) of EtOH exposed animals is significantly decreased (*p = 0.0246) in the CF region, (D) and significantly increased in the PF white matter compared to air controls (**p = 0.0047, n = 4–5 per treatment group). (E) Oligodendrocyte lineage cell densities were estimated within the CF and PF regions of posterior corpus callosum at P50. The densities of OLs did not differ based on treatment (p = 0.5632), however, the densities of OL lineage cells were statistically different between regions (*p = 0.0175, n = 4 per treatment group, 2-way ANOVA).

