
Figure 1.
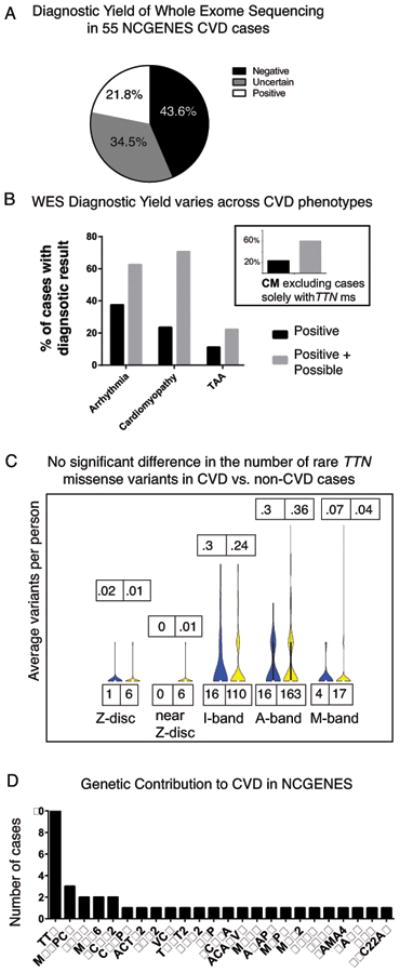
A. WES diagnostic yield in a clinically diverse set of 55 CVD patients. B. Diagnostic yield differs among CVD phenotypic classes. Grey bars: VUS. Inset shows yield minus cases solely with TTN ms variants. C. The distribution of rare TTN missense variants does not differ significantly between CVD and non-CVD NCGENES participants. For each gene region, the number of rare variants (MAF < 0.002) in cases (blue) and controls (yellow) is shown on the bottom. Top numbers show average number of variants in cases then controls for each region of amino acids (NM_001267550.1): Z-band (1-831), Near Z-band (832-2169), I-band (2170-15655), A-band (15656-33588), M-band (33589-35992). D. Genes in which variants were reported back to NCGENES CVD participants. The number of cases in which variants in each gene were reported is shown on the y-axis.