
Figure 5.
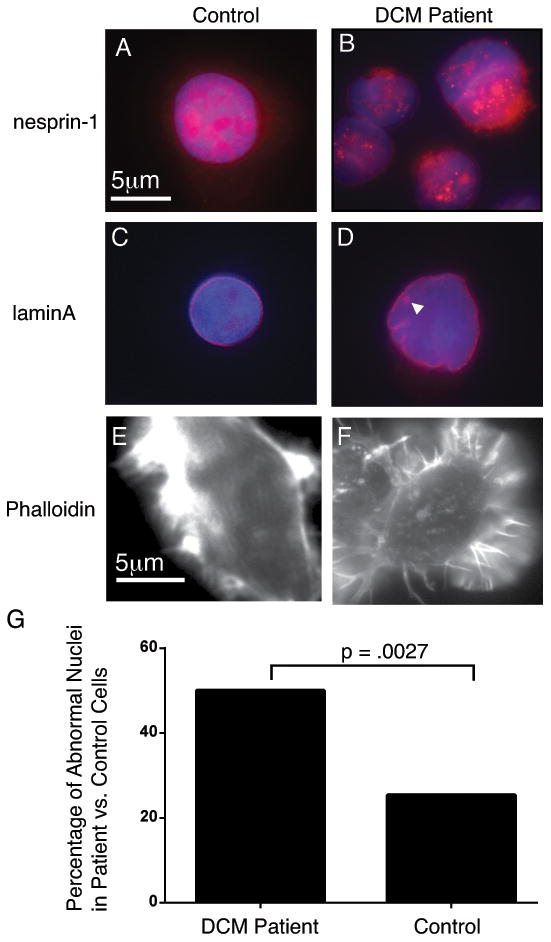
Cells from the patient carrying a SYNE1 splice site variant display nuclear morphology consistent with NE disruption. A. Control cells exhibit nesprin 1 staining throughout the nucleus and into the cytoplasm. B. Cells from the DCM patient express nesprin-1, although staining appears less consistent, with some nuclear regions appearing unstained. C. Lamin A staining in control cells defines a spherical perinuclear ring. D. Lamin A staining in DCM patient cells with irregular nuclei. Note the ring of lamin A staining seen inside the nucleus (arrowhead). E. Phalloidin staining in control cells show linear arrays of actin. F. The actin in DCM patient cells appears less organized and more globular than control cells. G. Percentage of cells with abnormal nuclei is significantly higher in cells from the DCM patient with the SYNE1 (50/94) variant vs. control cells (25/63).