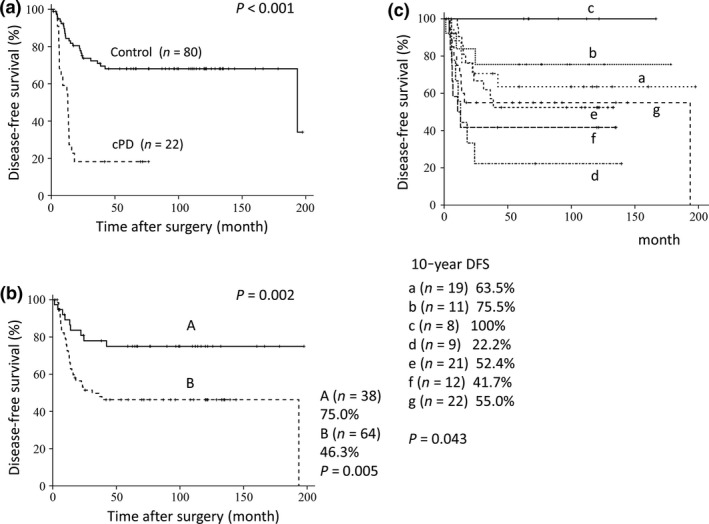
Figure 4.

Disease‐free survival curves for patients with triple‐negative breast cancer. (a) Curves for the cPD group (n = 22) and the control group (n = 80). (b) Curves for the A (n = 38) and B (n = 64) groups determined by the cluster analysis. (c) Curves for seven subgroups (a–g) determined by the cluster analysis.
