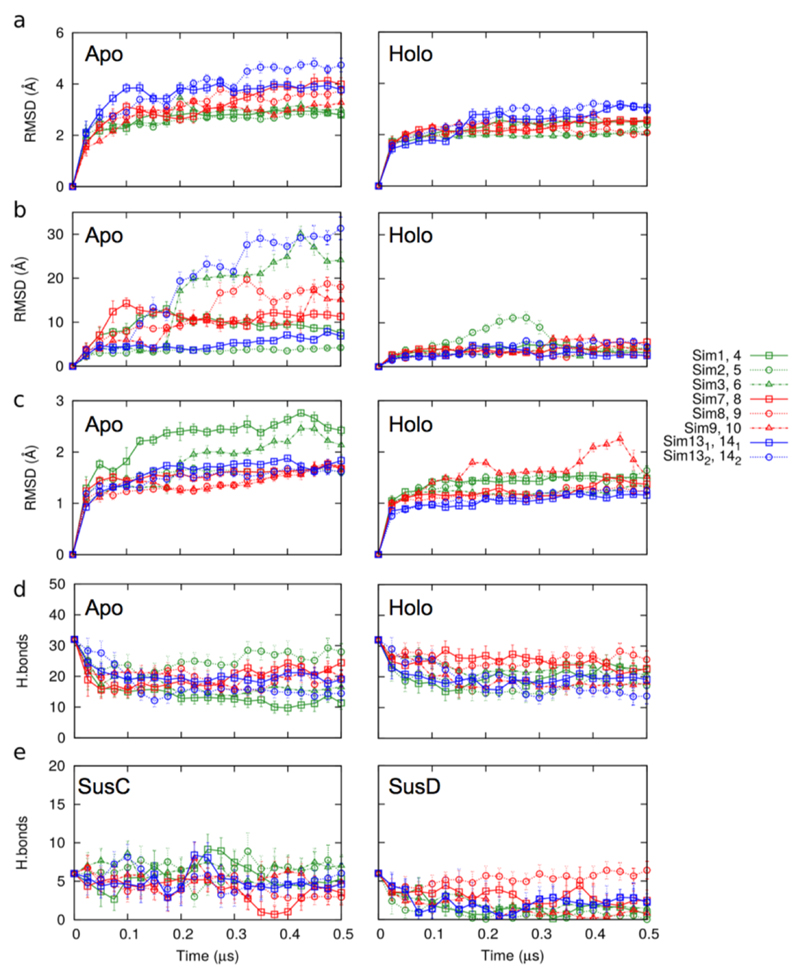
Extended Data Fig. 6. MD simulations for BT2261-64.
a, Plots of BT2264 (SusC) Cα RMSD vs. simulation time for holo and apo complexes. b and c, Plots of BT2263 (SusD) Cα RMSD vs. simulation time for holo and apo simulations, relative to the starting conformation (b) and after SusD superposition (c). d,e Plots showing the number of hydrogen bonds between SusC and SusD vs. simulation time (d) and between holo SusCD and the modeled peptide (e). Simulations are numbered as follows: sim1-3, apo BT2263-64 (dimer); sim7-9, apo BT2261-64 (tetramer); sim13, apo (BT2261-64)x2 (octamer); sim4-6, holo BT2263-64; sim10-12, holo BT2261-64; sim14, holo (BT2261-64)x2. With the exception of those of the octamer owing to its very large size, the simulations were repeated three times with different initial atomic velocities to allow sampling in order to obtain a measure of the possible spread in results.

