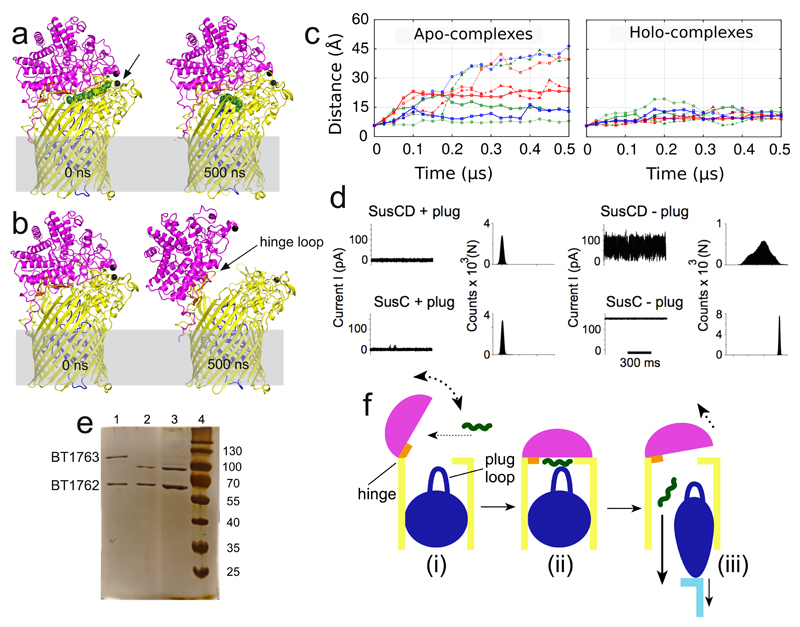
Figure 4. SusCD complexes transport their substrates via a pedal bin mechanism.
a and b, MD simulation snapshots of holo (a) and apo (b) BT2263-64 after 0 ns and 500 ns. SusC is coloured yellow with the plug domain in dark blue; SusD is shown in magenta. Cα atoms of Asn203 in SusC and Thr296 in SusD are shown as black spheres. c, Average distances vs. simulation time between SusC-Asn203 and SusD-Thr296 for SusCD dimers (green), BT2261-64 tetramers (red), and the (BT2261-64)x2 octamer (blue). d, Single channel electrophysiology traces and corresponding all-point histograms for BT1762-63 complexes (SusCD +/- plug) and for BT1763 (SusC +/- plug). Traces and histograms are representatives of 10 experiments. e, SDS-PAGE of BT1762-63 before (lane 1) and after (lane 2) incubation for 2 weeks at room temperature, and from crystal drops (lane 3). f, General mechanism for nutrient uptake via SusCD transport complexes, colour-coded as in panels a and b. Ligand is shown as a green wavy line and the C-terminal domain of TonB that interacts with the SusC plug is cyan.

