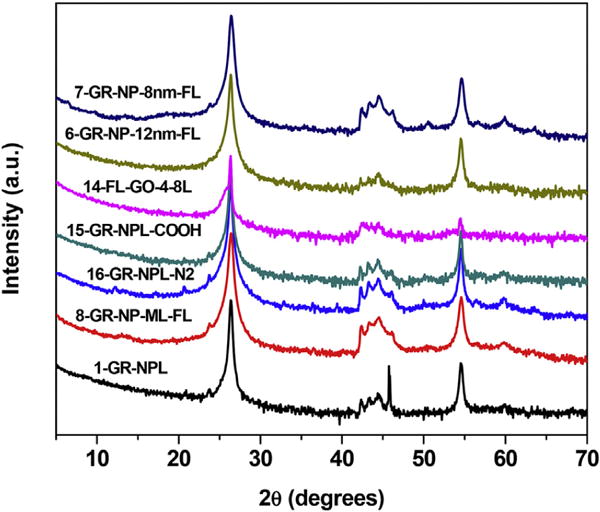
Fig. 1.

X-ray diffraction patterns of the samples of group A with the spectra shifted vertically for clarity. The first number in the names of the samples is the sample number listed in Table 1. Note that the intensities are plotted on a log scale to highlight the weaker lines. (A colour version of this figure can be viewed online.)
