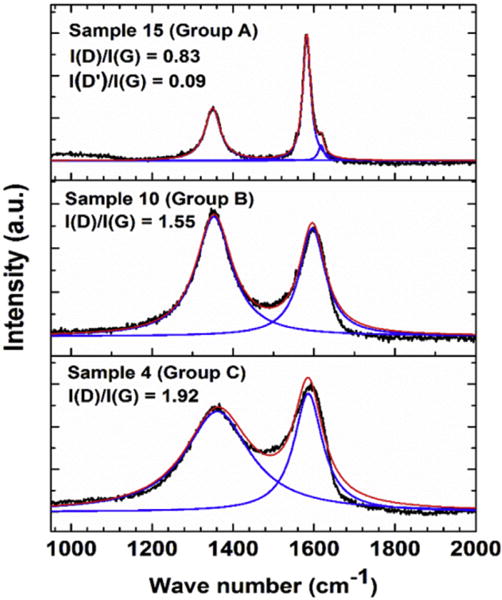
Fig. 7.

Fits of the Raman spectra for three samples, one each from groups A, B and C. Black lines represent the measured spectra, blue lines the fits to individual peaks and the red lines the overall fits. (A colour version of this figure can be viewed online.)
