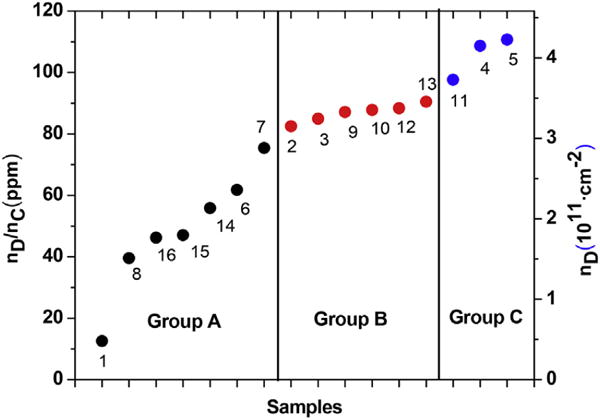
Fig. 8.

Same as in Fig. 6 except the plots are now for the defect density (right scale) and their concentrations in ppm (left scale) for all the samples. (A colour version of this figure can be viewed online.)

Same as in Fig. 6 except the plots are now for the defect density (right scale) and their concentrations in ppm (left scale) for all the samples. (A colour version of this figure can be viewed online.)