
Figure 5.
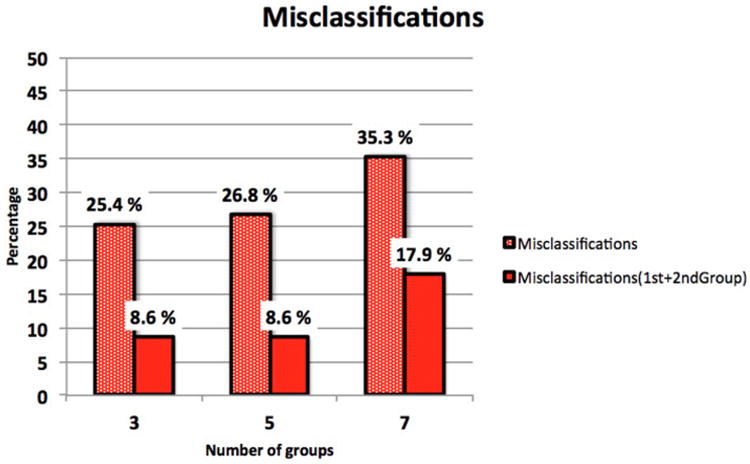
Percentage of statistical shape analysis misclassifications when the TMJ OA condyles were classified into 3, 5, or 7 OA subgroups, plus the healthy condyles subgroup. The dotted red bars show the percentages of misclassification when the condylar morphology is classified to the group to which this MRSE distance is the smallest. The solid red bars show the percentages of misclassification to the 2 groups to which this MRSE distances are the smallest.