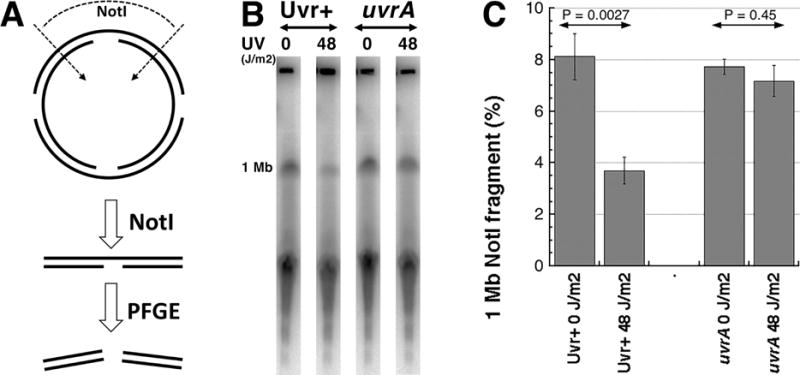
Fig. 2. Nicked linear pieces are additionally fragmented during electrophoresis.

A. A scheme of the experiment: early-stationary cells were exposed to UV and made into agarose plugs as described in figure 1. The agarose plugs were washed in TE, digested with Not I and subjected to pulsed-gel electrophoresis to reveal any decrease in 1 Mbp band [11].
B. A representative pulsed-field gel of NER+ (AB1157) versus NER− (uvrA mutant, SRK303-1) cells. 1 Mb, the 1 Mbp Not I fragment, whose quantity is shown in “C” as the fraction of the total DNA signal in the gel.
C. Quantification of several gels like in “B”. The data are averages ± SEM, with n = 4 or 5. P is two-tail probability that the two values are different. The two values in the NER+ cells are (P<<0.05).
