Figure 2.

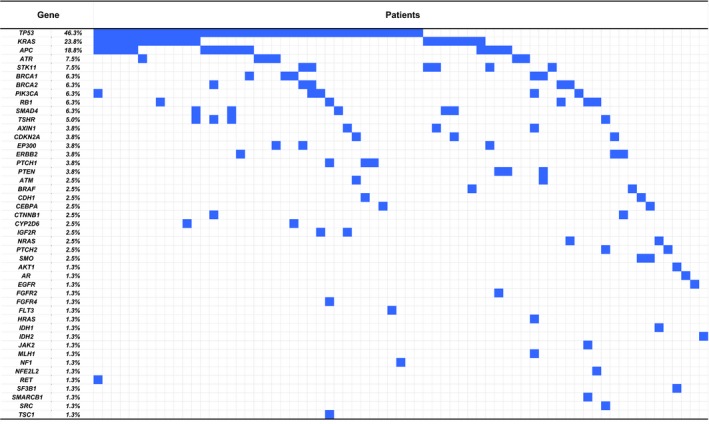
Heat map describing potentially actionable mutations identified in each patient. Each column represents one patient, and each row represents one gene. Potentially actionable mutations are shown in blue.

Heat map describing potentially actionable mutations identified in each patient. Each column represents one patient, and each row represents one gene. Potentially actionable mutations are shown in blue.