Figure 3.

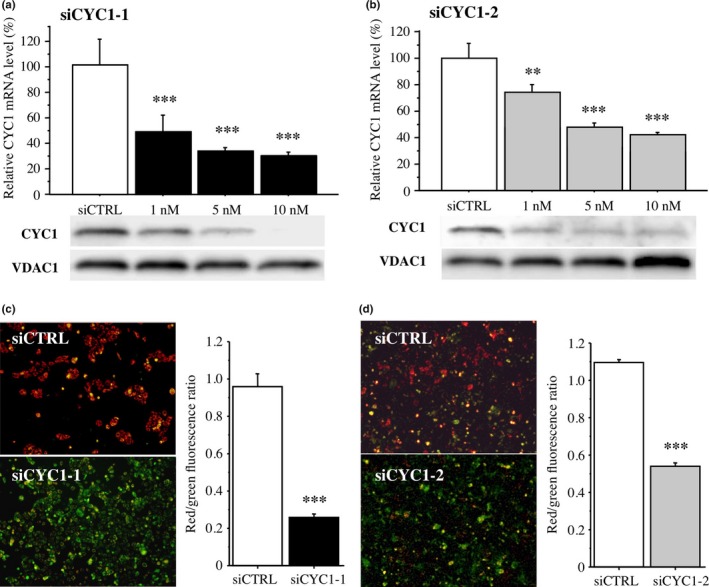
Effects of cytochrome c1 (CYC1) on mitochondrial membrane potential in MCF10DCIS.com ductal carcinoma in situ cells. (a,b) Upper panel shows expression of CYC1 mRNA in MCF10DCIS.com cells transfected with CYC1‐specific siRNA (siCYC1‐1 [a, closed bar] and siCYC1‐2 [b, gray bar]) or negative control siRNA (siCTRL, open bar) by real‐time PCR. Lower panel shows the corresponding CYC1 immunoreactivity by immunoblotting. Voltage‐dependent anion channel 1 (VDAC1) immunoreactivity is shown as an internal control of mitochondrial protein. (c,d) JC‐1 assays in MCF10DCIS.com cells transfected with siCYC1‐1 (c; 10 nM, closed bar) and siCYC1‐2 (d; 10 nM, gray bar) or siCTRL (open bar). Left panels show representative merged images. Green fluorescence shows JC‐1 monomer (low mitochondrial membrane potential) and red fluorescence represents JC‐1 aggregate (high mitochondrial membrane potential); cells show yellow if both fluorescence are similar levels. Right panels show their red/green fluorescence ratio. Data are presented as mean ± SD (n = 3). Statistical analyses were carried out using Student's t‐test and Fisher's PLSD test. **P < 0.01; ***P < 0.001 versus control cells transfected with siCTRL (left open bar).
