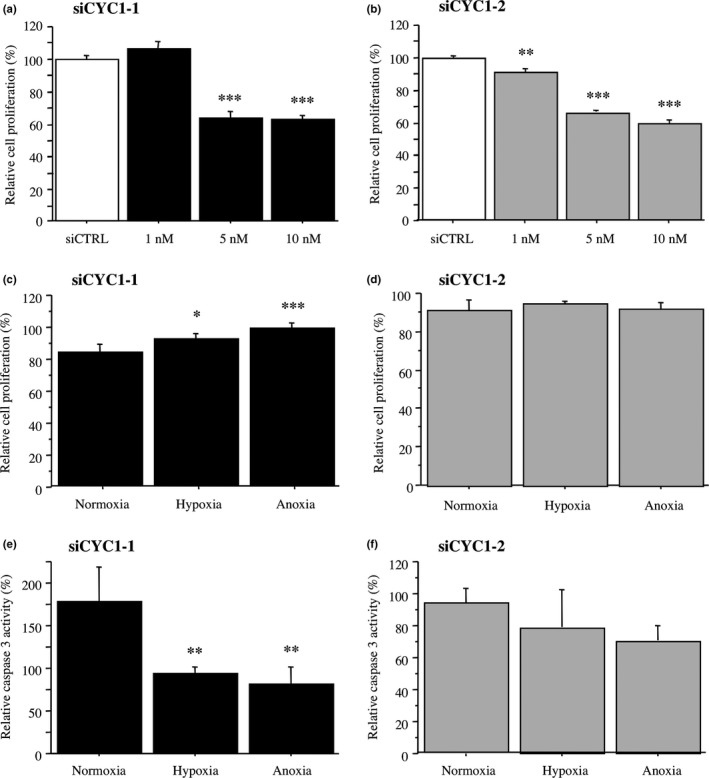
Figure 4.

Effects of cytochrome c1 (CYC1) knockdown on cell proliferation and caspase 3 activity under hypoxia in MCF10DCIS.com ductal carcinoma in situ cells. (a,b) WST‐8 assay in MCF10DCIS.com cells transfected with siCYC1‐1 (a, closed bar), siCYC1‐2 (b, gray bar), or negative control siRNA (siCTRL; open bar). Relative proliferative activity of these cells was summarized as a ratio (%) compared to the control cells transfected with siCTRL at 4 days after treatment (left open bar). (c,d) WST‐8 assay in MCF10DCIS.com cells transfected with siCYC1‐1 (10 nM) (c) or siCYC1‐2 (10 nM) (d) under normoxia, hypoxia, or anoxia for 2 days. Relative cell proliferation activity was evaluated as a ratio (%) compared to the mean value of control cells transfected with siCTRL under the same conditions. (e,f) Caspase 3 activity assays in MCF10DCIS.com cells transfected with siCYC1‐1 (10 nM) (e) or siCYC1‐2 (10 nM) (f). Cells were incubated under the indicated conditions for 5 h. Relative caspase 3 activity was evaluated as a ratio (%) compared to the mean value of control cells transfected with siCTRL under the same condition. Data were presented as the mean ± SD (n = 3). Statistical analyses were carried out using Fisher's PLSD test. *P < 0.05; **P < 0.01; ***P < 0.001 versus left bar.
