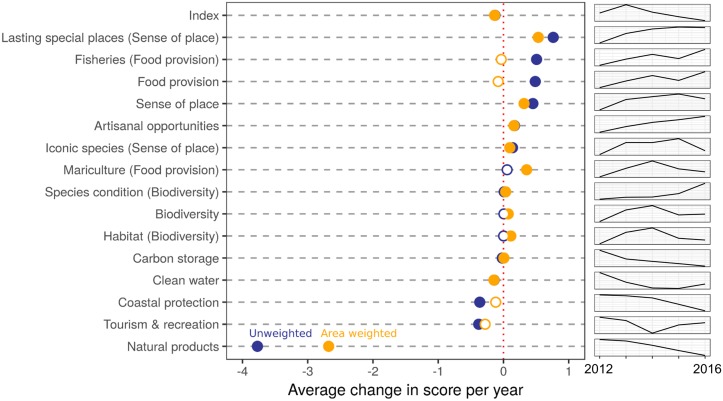
Fig 2. Global average yearly change in goal scores from 2012–2016.
Average annual change in global status for each goal and subgoal, unweighted (blue dots) and weighted by size of EEZ (orange dots). Solid circles indicate trends significantly different from zero; open circles are non-significant. Plots on the right show change over time in the global goal score (y-axis scaled to the range of values for each goal). Large differences between unweighted and weighted values (e.g. natural products and fisheries) result from countries with large EEZs having scores significantly different from the global average.

