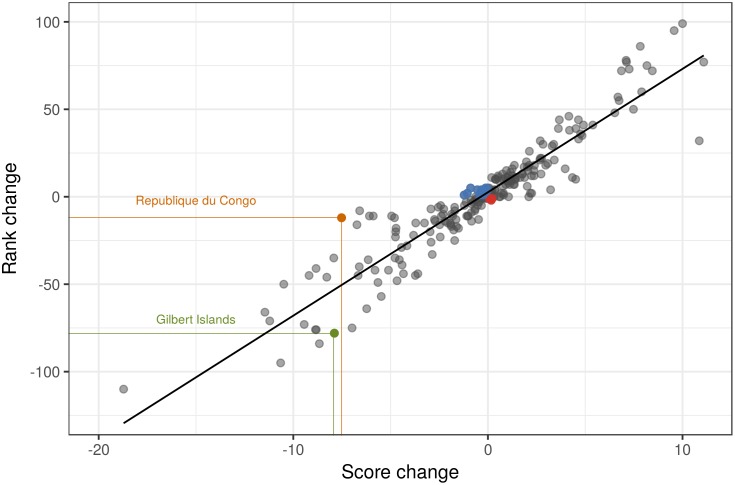
Fig 6. Relationship between change in OHI score and rank.
The change in each country’s OHI score and rank was calculated from 2012 to 2016. Black line is the linear regression slope estimate. A comparison of the Republique du Congo and Gilbert Islands (Kiribati) illustrates how roughly the same change in score (-7.52 vs. -7.89, respectively) can result in a very different change in rank (-12 vs. -78); note also cases where the same change in rank can result from very different changes in scores (not highlighted). Blue points indicate regions that had a decrease in score but an increase in rank (N = 12); and red points indicate an increase in score and decrease in rank (N = 4).

