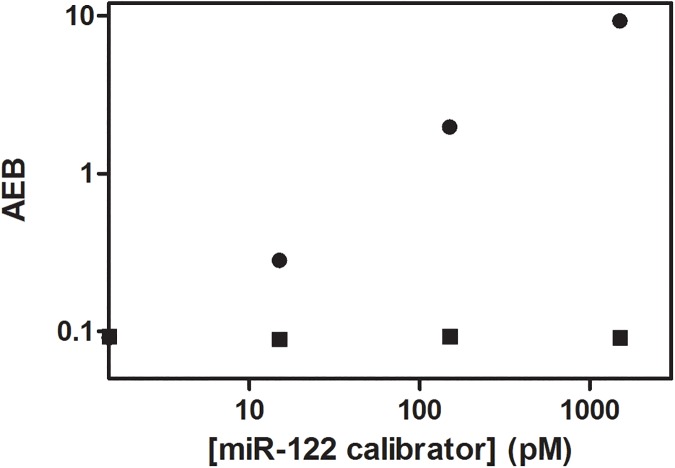
Fig 3. Plot of AEB determined using the assay in Fig 1 against concentration of calibrators for miR-122 (circles) and the same molecule with a single base mismatch at the 9th position (squares) spiked into buffer.
The sequences of these two molecules are shown in S2 Table. Error bars (±1 s.d.) based on duplicate measurements are smaller than the size of the data point.

