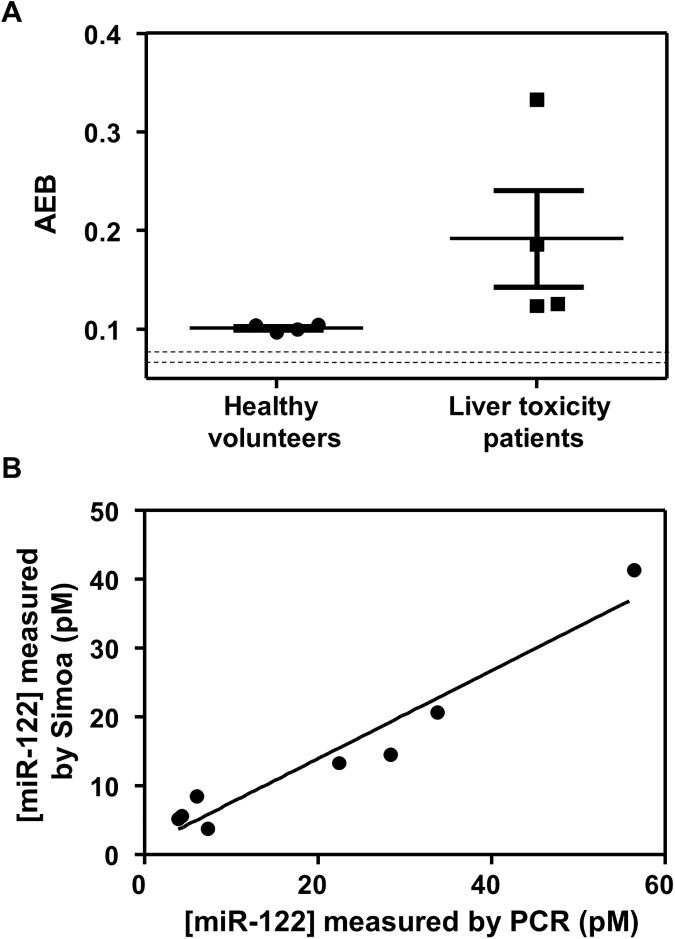
Fig 4.
(A) Scatter plot of AEB for miR-122 measured in the serum of 4 healthy volunteers and 4 individuals after overdosing on acetaminophen. The dotted lines represent the mean assay (buffer) background ± 1 s.d.. (B) Correlation of concentration of miR-122 in the serum of patients determined using Simoa and PCR (r2 = 0.93; slope = 0.64).

