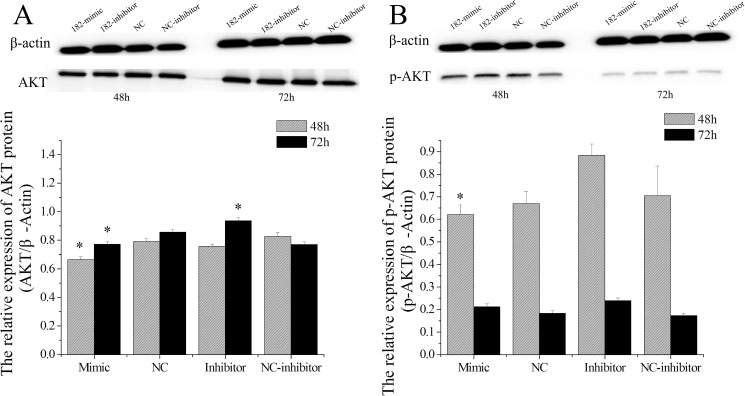
Fig 11. The effect of miR-182 on AKT and p-AKT levels in endometrial epithelium cells (EECs).
AKT protein levels (A) in EEC cells, p-AKT protein levels (B) were measured by WB, densitometry was normalized to the β-actin density from the same lane. Each experiment was repeated three times in triplicate, the results are represented as “means ± SD” (n = 3×3), ** indicates that P < 0.01 and * p < 0.05. The date was analyzed only compared to its corresponding NC at the same timing.

