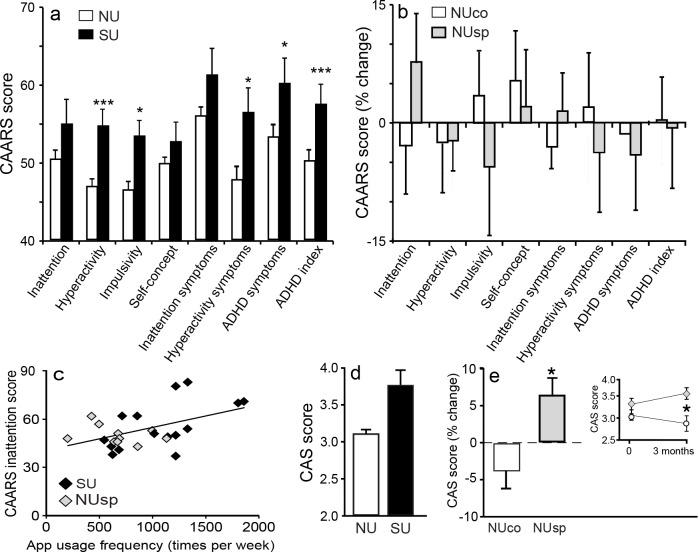
Fig 2. Questionnaire results and their correlation with real usage frequency.
Bar charts show mean ± SEM values. (a) CAARS score from the first phase. Total ADHD index (t (49) = 2.8, p = 0.008, d = 0.8), impulsivity (t (49) = 2.5, p = 0.01; pcorrected = 0.07, d = 0.75) and hyperactivity (t (49 = 2.9, p = 0.006, pcorrected = 0.035, d = 0.7) scores were significantly higher in the SU group as compared to the NU group. ADHD symptoms (t (49) = 2.2, p = 0.03, pcorrected = 0.21, d = 0.61) and hyperactivity symptoms (t (49) = 2.3, p = 0.02, pcorrected = 0.14, d = 0.68) also showed a non-significant trend in the same direction (b) Changes in CAARS scores between end and start of intervention in the second study phase is shown. No significant differences between groups were observed (p>0.2 for all domains). (c) The scatterplot shows a marginally significant positive correlation between the total frequency of app usage and CAARS inattention subscales of both SU and NUsp participants (R (24) = 0.5, p = 0.013, pcorrected = 0.08). (d) SU obtained higher CAS (social concern) score than NU (t (49) = -2, p = 0.052, d = 0.61). (e) A significant interaction effect of the manipulation on CAS scores was found (F (1,24) = 6.4, p = 0.018, η2p = 0.21). Posthoc analysis revealed a significant increase (p = 0.034) from baseline in CAS score in the NUsp group while NUco showed a mild non- significant decrease in CAS (p = 0.15). pcorrected term refers to instances of multiple comparisons where the p value was Bonferroni corrected.

