Fig. 5.
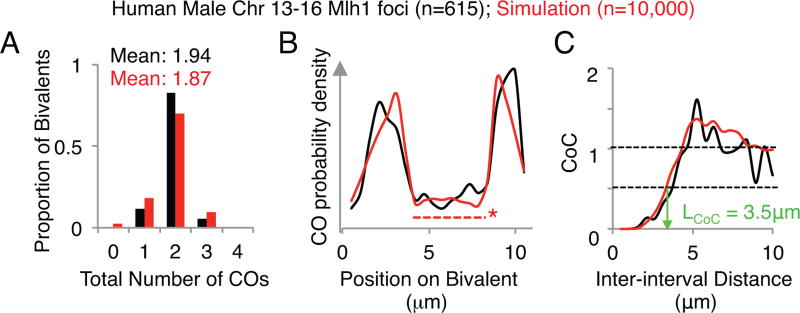
The distribution of Mlh1 foci along human male chromosomes 13,14, 15 and 16 were analyzed (615 bivalents in total) and simulated (10,000 bivalents total). Values for data are shown in black, values for simulation are shown in red. The parameters used in this simulation can be found in Table 1. (A) The mean number of total COs and the distribution of total CO numbers across the population. (B) The density distribution of COs along the length of chromosome(s). The dashed line with an asterisk indicates the region of the chromosome corresponding to the simulated ‘Black Hole’. (C) Coefficient of coincidence analysis. LCoC 0.5 (the inter-interval distance at which the CoC value is 0.5) is approximately 3.5 µm for both the data and the simulation.

