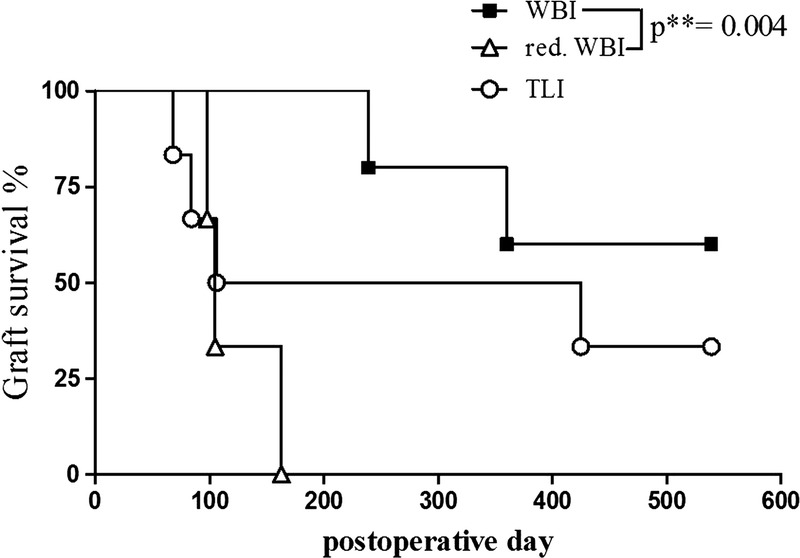
FIGURE 4.

Kaplan-Meyer survival curve. Per the Gehan-Breslow-Wilcoxon test, survival differed significantly between the treatment groups WBI and reduced WBI (**P = 0.004). The TLI group with 3 early rejectors but also 2 long-term surviving animals showed no statistical significance to either side.
