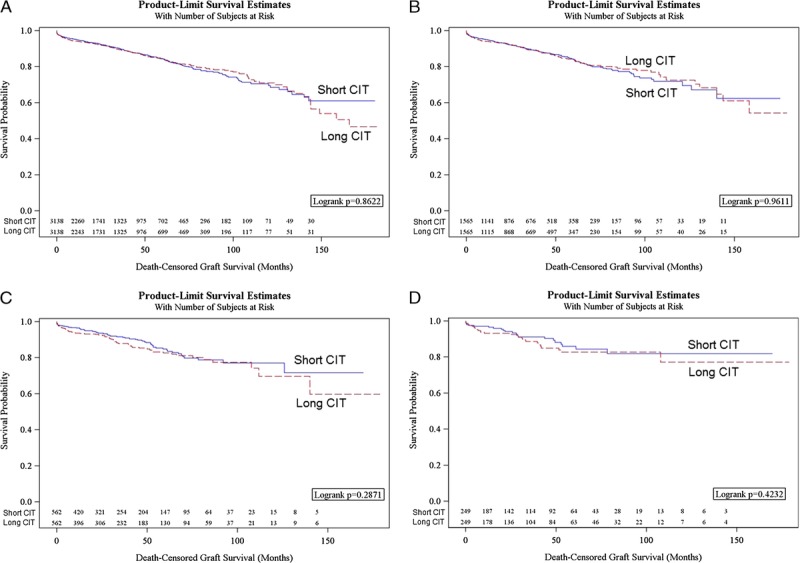
FIGURE 2.

A, Kaplan-Meier plots of DCGS, all-cause graft survival, and patient survival in pairs with shorter and longer cold ischemia time with 1 hour or longer difference. B, Kaplan-Meier plots of DCGS, all-cause graft survival, and patient survival in DCD donor pairs with shorter and longer cold ischemia time with 5 hours or longer difference. C, Kaplan-Meier plots of DCGS, all-cause graft survival, and patient survival in pairs with shorter and longer cold ischemia time with 10 hours or longer difference. D, Kaplan-Meier plots of DCGS, all-cause graft survival, and patient survival in pairs with shorter and longer cold ischemia time with 15 hours or longer difference.
