FIGURE 1.

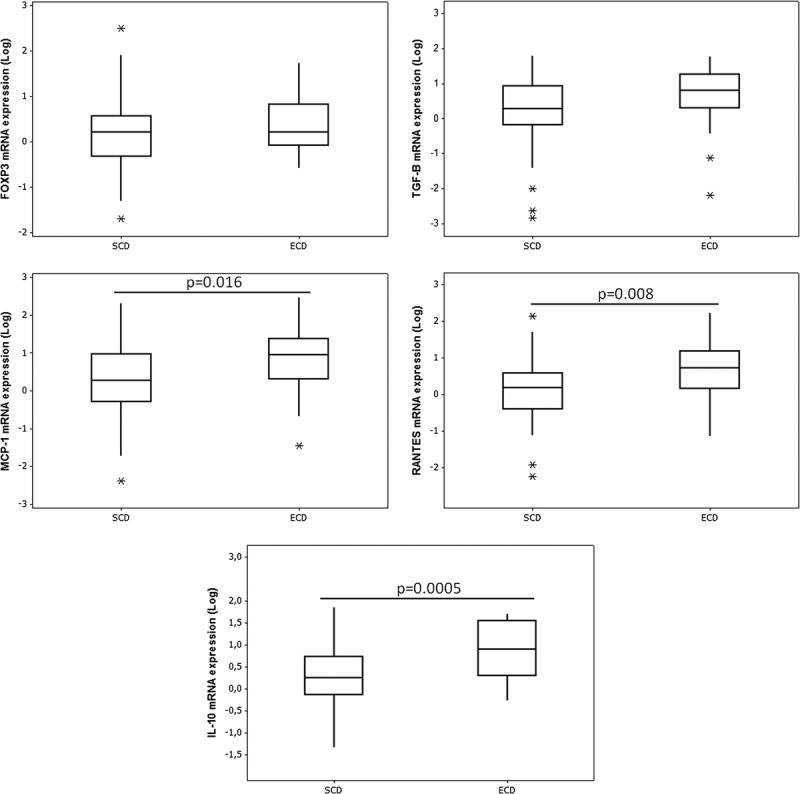
Relative mRNA expression of FOXP3, TGF-B, MCP-1, RANTES, and IL-10 genes in PIBx. Box-plot representation of median and quartile values. The whiskers are indicating range and asterisks represent outliers.

Relative mRNA expression of FOXP3, TGF-B, MCP-1, RANTES, and IL-10 genes in PIBx. Box-plot representation of median and quartile values. The whiskers are indicating range and asterisks represent outliers.