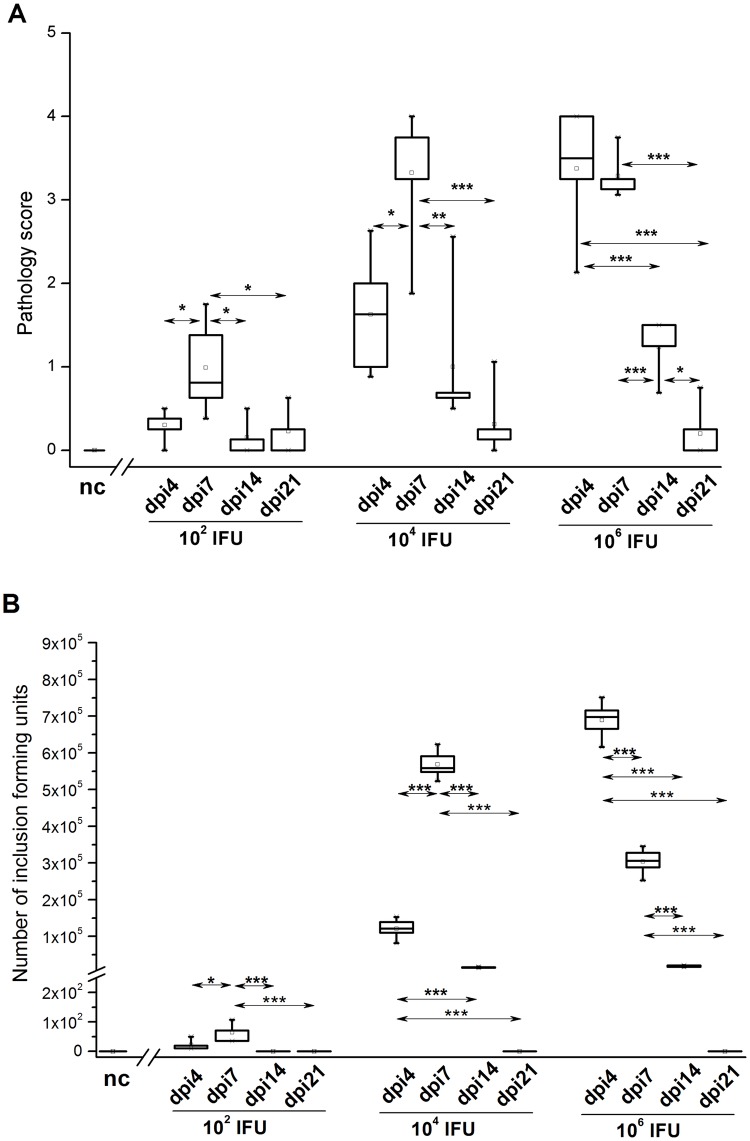
Fig 2. Ocular pathology scores (A) and C. caviae load (B) in guinea pigs infected with a single ocular instillation of three different C. caviae doses.
The amount of C. caviae applied per guinea pig eye (expressed as IFU) and screening time points within the post-infection period (day 4 –dpi4, day 7 –dpi7, day 14 –dpi14, and day 21 –dpi21) are indicated on the x-axis. The start of infection is considered as day 0. Age-matched non-infected guinea pigs (nc) were used as negative controls. Statistical significance of the observed differences was evaluated using two-way ANOVA test followed by Tukey’s multiple comparisons test. The statistical significance of differences in parameter values between specific time points (compared groups indicated with arrows) for guinea pigs infected with an equal amount of C. caviae is indicated as follows: * P<0.05, ** P<0.005, and *** P<0.001.

