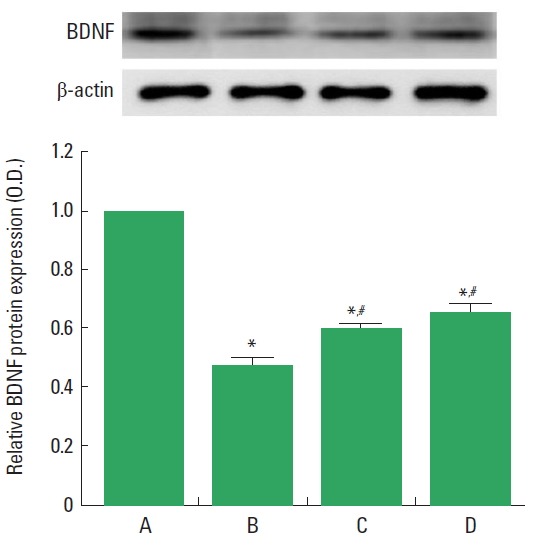
Fig. 3.

Brain-derived neurotrophic factor (BDNF) expression. Upper panel: Representative expression of the BDNF and β-actin. Lower panel: Relative BDNF expression in each group. A, sham-operation group; B, spinal cord injury group; C, spinal cord injury and bone marrow stromal cells transplantation group; D, spinal cord injury and bone marrow stromal cells transplantation with treadmill exercise group. Values are presented as mean±standard error of the mean. *P<0.05 compared to the sham-operation group. #P<0.05 compared to the spinal cord injury group.
