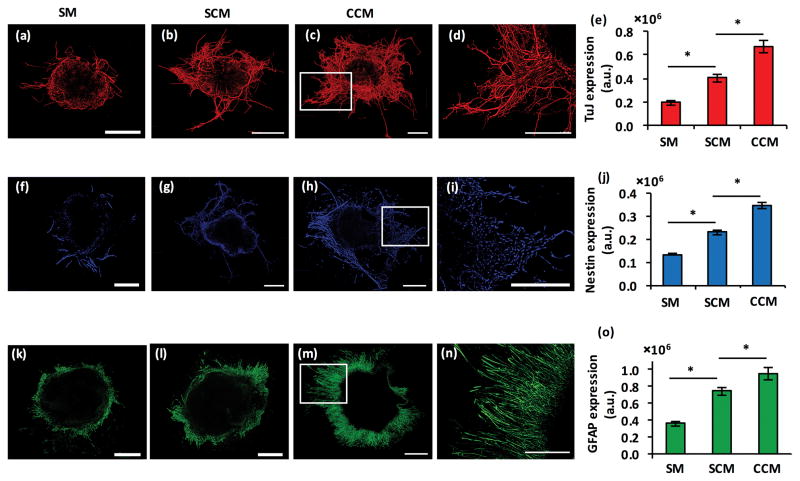
Figure 4.
(a–c) TuJ-stained colonies of mESCs in co-culture with PA6 cells in a microwell under treatment with SM, SCM, and CCM, respectively. (d) Magnified view of neurite processes from the panel (c) image. (e) Quantified neurites pixel density is computed from TuJ+ mESC colonies. Data represent day 8 co-cultures. (f–h) Nestin staining of a single mESC colony in co-culture with PA6 cells in a microwell under treatment with SM, SCM, and CCM, respectively. (i) Magnified view of the boxed portion of the panel (h) image. (j) Pixel density computed from Nestin+ mESC colonies under different treatment conditions. Data represent day 8 cultures. (k–m) GFAP staining of a single mESC colony in co-culture with PA6 cells in a microwell under treatment with SM, SCM, and CCM, respectively. (n) Magnified view of the boxed portion of the panel (m) image. (o) Pixel density computed from GFAP+ mESC colonies under different treatment conditions. Data represent day 14 cultures. Scale bar is 500 μm. *p<0.01. The number of replicates for each treatment was N=20.

