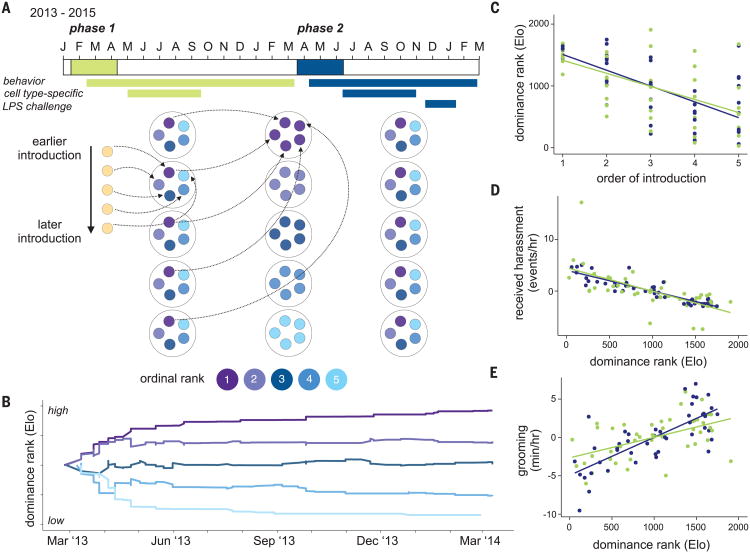
Fig. 1. Experimental paradigm.
(A) Timeline for group formation in phase one (green: January 2013 to March 2014) and phase two (blue: March 2014 to March 2015), with timelines for behavioral data collection and sample collection shown below.The schematic below the timeline illustrates how groups were formed in phase one, rearranged at the study midpoint, and allowed to organize into new hierarchies during phase two. (B) Example of group formation: Each line represents a different female, introduced sequentially into a new social group. All females entered the group with the same Elo rating but rapidly established a stable hierarchy that persisted until the end of phase one. (C) Order of introduction into a newly formed social group predicted dominance rank (Elo rating) in phase one (green: Pearson's r = −0.57, P = 4.1 × 10⁻⁵) and phase two (blue: r = −0.68, P = 3.3 × 10⁻⁷). (D) Dominance rank predicted rates of received harassment in phase one (green: r = −0.64, P = 2.0 × 10⁻⁶) and phase two (blue: r = −0.90, P = 1.8 × 10⁻¹⁷). (E) Rates of grooming interactions in phase one (green: r = 0.53, P = 2.1 × 10⁻⁴) and phase two (blue: r = 0.75, P = 4.0 × 10⁻⁹). In (C) to (E), lines show the best-fit slope and intercept from a linear model. Rates of harassment and grooming in (D) and (E) are mean-centered to 0 for each social group.

