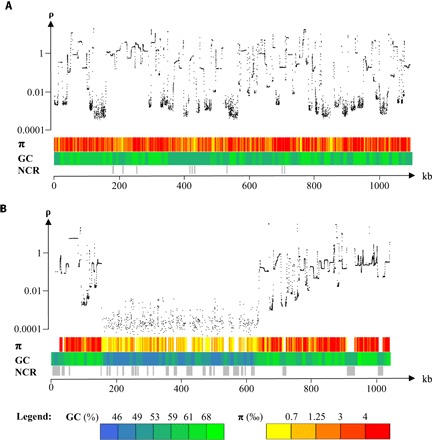
Fig. 2. Variation of the population recombination rate (ρ), nucleotide diversity (π), and GC content (GC) along chromosomes of O. tauri.

(A) Chromosome 1, a standard chromosome. (B) Chromosome 2. ρ, population-scaled recombination rate (per kilobase) inferred from SNP using the program interval of LDhat package; π, nucleotide diversity per site averaged across 2.5-kb windows; GC, averaged GC percent across 10-kb windows; NCR, noncallable regions of at least 1 kb, where polymorphisms could not be called because of insufficient coverage (<10×) or because of too high coverage suggestive of regions in multiple copies, which are not represented in the reference sequence. ρ and π are computed using SNPs segregating among the 13 strains for chromosome 1 and 12 strains (RCC4221 is excluded) for chromosome 2. For chromosome 2, the reference strain RCC4221 was excluded because of its high divergence with the other strains on the candidate MAT locus region; the sequence of chromosome 2 of strain RCC1115 was used instead.
