
Fig. 4. Chromosome 19 sequence conservation in six O. tauri strains.
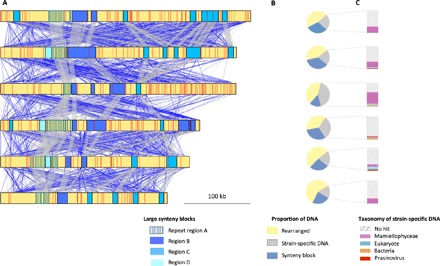
(A) Large synteny blocks along chromosome 19 are represented as rectangles (fig. S6), and red lines indicate location of strain-specific DNA. Pairwise local alignments between strains are represented in gray (sense) or blue (antisense) (blastn with scores between 50 and 500 and percentage alignment identities >95%). (B) Proportion of DNA in chromosome in syntenic regions, in rearranged regions, and in strain-specific regions. (C) Taxonomic affiliation of strain-specific sequences using sequence homology against GenBank (tblastx) (69).