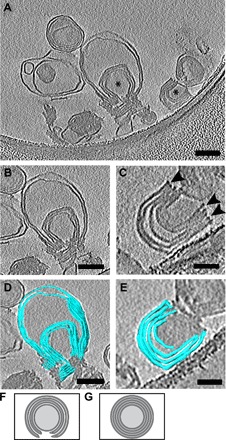
Fig. 3. MLAs examined by cryo-ET.

(A) Representative tomographic slices (1.47 nm) of two MLAs. *, MLAs in image. (B and C) Two MLAs from (A). Arrowheads indicate the ends of MLA. (D and E) Segmentation view of the corresponding MLA from (B) and (C). Scale bars, 100 nm (A, B, and D) and 50 nm (C and E). (F) Model demonstrating the compressed wrapped membranes of an MLA. (G) Model demonstrating the nesting vesicles of MLVs.
