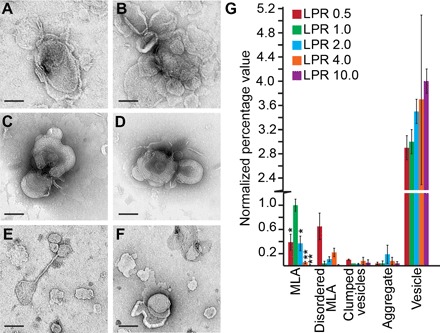
Fig. 4. Altered PMP22 LPRs disrupt MLA formation.

Representative negative stain images of PMP22 reconstitution assays carried out at LPRs (w/w) of 0.5 (A and B), 1.0 (C and D), and 10.0 (E and F). Scale bars (all panels), 100 nm. (G) Quantification of the relative percentage of MLAs present in a series of negative stain EM images of WT PMP22 reconstitutions at LPRs (w/w) of 0.5, 1.0. 2.0, 4.0, and 10.0. All individual object counts were converted to the percentage of total counts for a particular sample and were normalized to the percentage of counts represented by MLAs in the LPR 1.0 sample, which was set to 1.0. Red, LPR 0.5; green, LPR 1.0; blue, LPR 2.0; orange, LPR 4.0; purple, LPR 10.0. Error bars represent SEM between biological replicates. *P < 0.05, **P < 0.01. Statistical significance is only indicated for MLAs.
