
Figure 6.
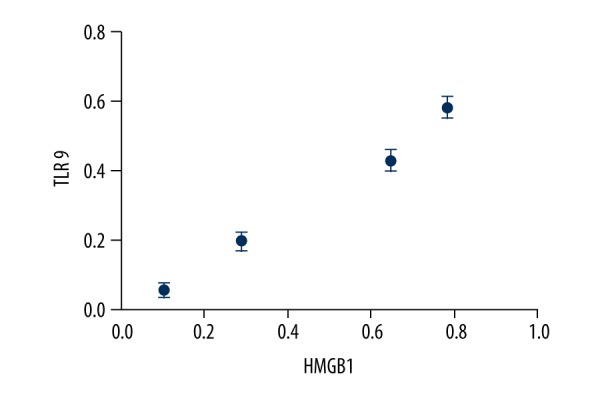
Correlation analysis chart between HMGB1 and TLR9. The value of p is 0.042, the value of r is 0.991. There was a significant positive correlation between HMGB1 and TLR9.
Official websites use .gov
A
.gov website belongs to an official
government organization in the United States.
Secure .gov websites use HTTPS
A lock (
) or https:// means you've safely
connected to the .gov website. Share sensitive
information only on official, secure websites.
Correlation analysis chart between HMGB1 and TLR9. The value of p is 0.042, the value of r is 0.991. There was a significant positive correlation between HMGB1 and TLR9.