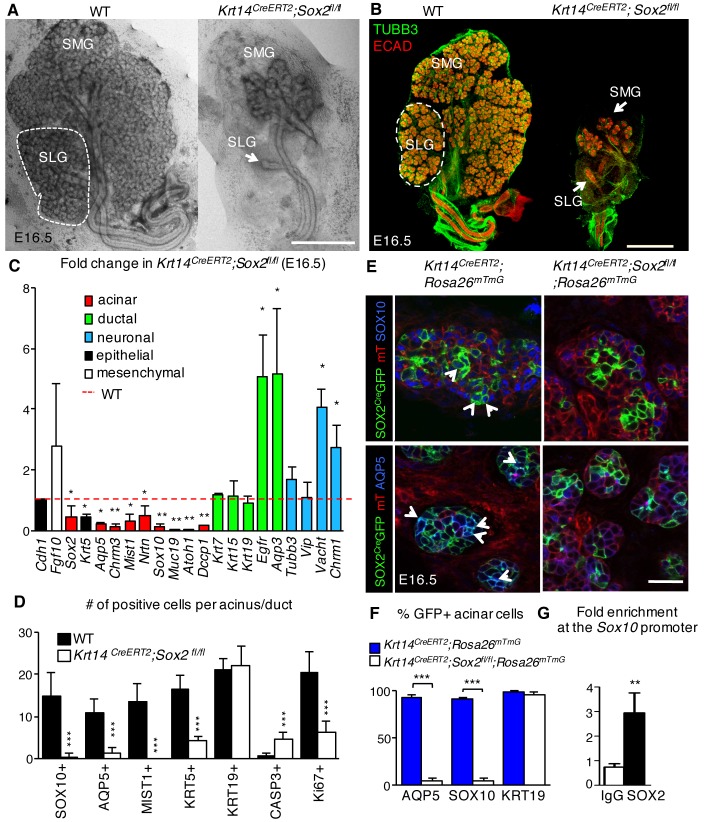
Figure 2. SOX2 is essential for establishing SOX10+ acini during organogenesis.
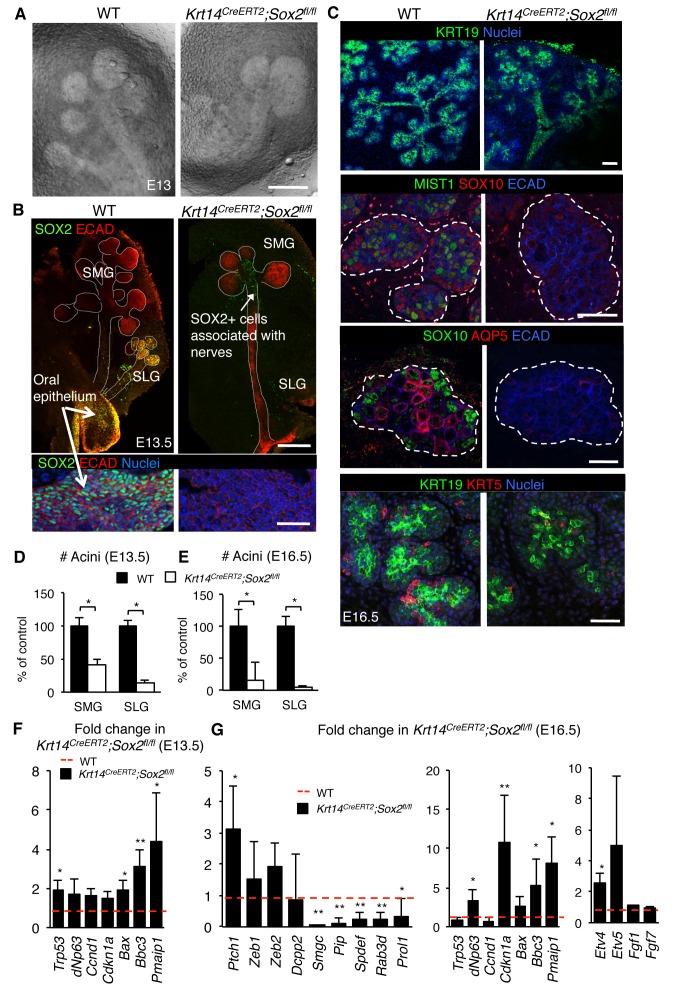
(A–D) SMG+SLG from Krt14CreERT2; Sox2fl/fl and wild-type (WT) embryos in which recombination was induced before gland ontogenesis at E10.5 and 11.5. (A) Representative brightfield images of Krt14CreERT2; Sox2fl/fl and wild-type (WT) SMG+SLG at E16.5. Scale bar is 1 mm. (B) Representative images of SMG+SLG immunostained for nerves (TUBB3) and epithelium (Ecadherin, ECAD). Scale bar is 1 mm. SMG = submandibular gland, SLG = sublingual gland. Dashed white line denotes SLG. (C) qPCR analysis of E16.5 Krt14CreERT2; Sox2fl/fl and wild-type (WT) SMG+SLG for genes involved in acinar differentiation, ductal differentiation and innervation, with expression normalized to Rsp29. Red dashed line = WT. n = 3 embryos per genotype. Data are means+s.d. and were analyzed using a one-way analysis of variance with post-hoc Dunnett’s test. *p<0.05, **p<0.01. (D) Quantification of cells expressing acinar or ductal markers, cleaved caspase-3 or Ki67 in acini of E16.5 in Krt14CreERT2; Sox2fl/fl and wild-type (WT). n = 2–4 glands/genotype and cells were counted in 3–4 acini/gland. Data are means+s.d. and were analyzed using a Student’s t-test, ***p<0.001. (E and F) SMG+SLG from Krt14CreERT2; Rosa26mTmG and Krt14CreERT2; Rosa26mTmG; Sox2fl/fl in which recombination was induced at E10.5 and 11.5 were immunostained for SOX10 and AQP5 (E) and GFP+ cells expressing SOX10 and AQP5 were quantified (F). n = 3 glands/genotype and cells were counted in 3–4 acini/gland. Data were subjected to a Student’s t-test, ***p<0.001. Scale bar in E is 20 µm. Arrowheads indicate double positive cells. (G) qPCR for enrichment of Sox10 in SOX2 ChIP. n = 20 pooled SLG, average three experiments, *p<0.05. Additional data for this figure in Figure 2—figure supplement 1.
DOI: http://dx.doi.org/10.7554/eLife.26620.004


