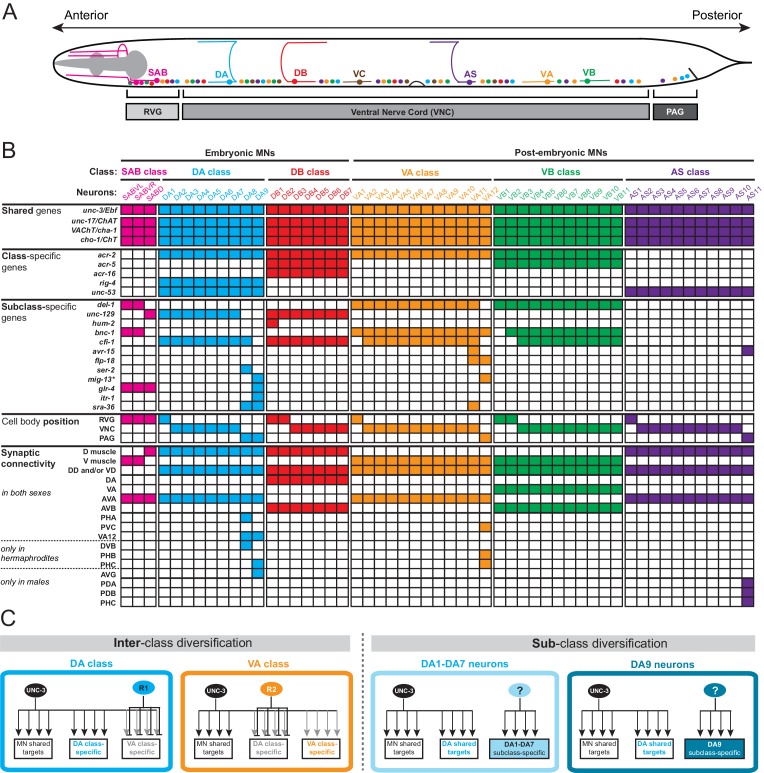
Figure 1. A map of subclass-specific genes provides an entry point to study MN subclass diversification.
(A) Schematic showing seven C. elegans MN classes (SAB, DA, DB, VA, VB, AS, VC), which are color-coded. Individual neurons of each class intermingle and populate three regions along the A-P axis; retrovesicular ganglion (RVG), ventral nerve cord (VNC), preanal ganglion (PAG). Axonal trajectory is shown only for one member of each class. (B) A map of effector gene expression with single-cell resolution. Each column represents an individual neuron. Genes that are shared, class- and subclass-specific are shown on the left. Cell body position and connectivity similarities and differences are also shown for each individual motor neuron. Asterisk next to mig-13 indicates additional expression (not shown) in MNs located in the VNC but anterior to vulva. (C) Inter-class versus sub-class diversification. The left panel shows known mechanisms for interclass-specification. Class-specific repressor proteins counteract unc-3’s activity, thereby generating ‘inter’-class diversity in C. elegans MNs (example of DA and VA class is shown) (Kerk et al., 2017). The right panel illustrates the problem of subclass diversification: Within a given class, the mechanisms controlling the expression of subclass-specific genes and thereby generate ‘intra’-class diversity are not known (example of DA class is shown).
DOI: http://dx.doi.org/10.7554/eLife.25751.002


