Figure 5.

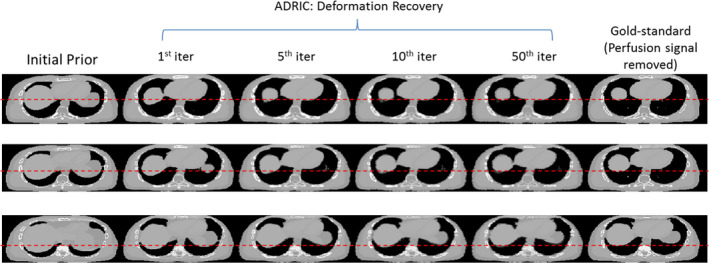
XCAT study: evolution of the ADRIC deformation‐recovered CT volume (μ comp‐DR ) with different iteration numbers. The reconstruction used 40 projections simulated with 105 incident photon counts for each pixel. The first column displays the axial slice cuts of the initial prior CT volume . The four columns in the middle show the axial slice cuts of the ADRIC deformation‐recovered CT volume after 1st, 5th, 10th, and 50th iterations, respectively. The last column displays the axial slice cuts of the “gold‐standard” new CT volume (note that the perfusion signal was removed from the images to facilitate comparisons). Different rows display axial slice cuts at different locations. The display window is [0.015, 0.05] mm−1. [Color figure can be viewed at wileyonlinelibrary.com]
