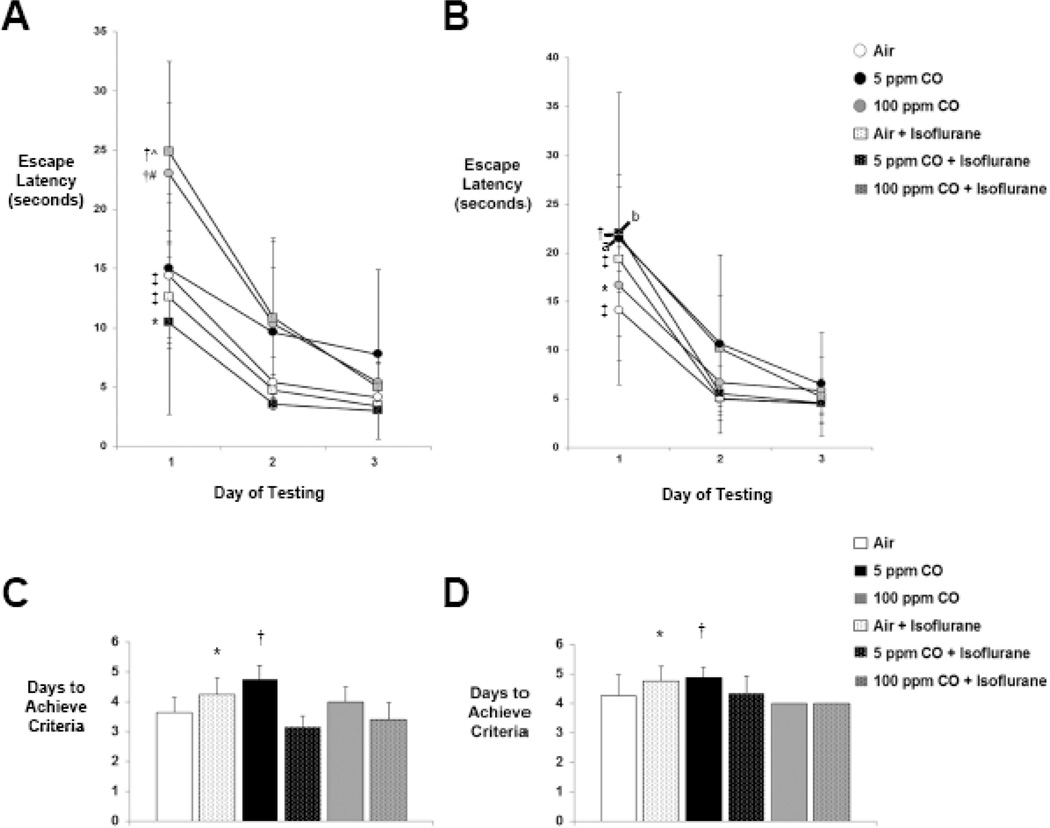
Figure 1. Spatial reference memory and cognitive flexibility following exposure.
A. Latency escape times from the T-maze during the first 3 days of spatial and B. reversal testing are shown. Values from the six experimental cohorts are expressed as means +/− standard deviation. *P < 0.05 Day 1 vs. Day 2 and Day 3 of testing within the cohort, †P < 0.01 Day 1 vs. Day 2 and P < 0.001 Day 1 vs. Day 3 of testing within the cohort, ‡P < 0.001 Day 1 vs. Day 2 and Day 3 of testing within the cohort, ^P < 0.05 vs. air-exposed controls and P < 0.01 vs. air + isoflurane and 5 ppm CO + isoflurane on Day 1 of testing, #P < 0.05 vs. air + isoflurane and P < 0.01 vs. 5 ppm CO + isoflurane on Day 1 of testing. aP < 0.05 Day 1 vs. Day 3 of testing within the cohort, bP < 0.01 Day 1 vs. Day 2 and Day 3 of testing within the cohort. C. Days to achieve criteria during memory acquisition testing are demonstrated. Values from the six experimental cohorts are expressed as means plus standard deviation. *P < 0.05 vs. air-exposed controls, P < 0.001 vs. 5 ppm CO + isoflurane, and P < 0.01 vs. 100 ppm CO + isoflurane. †P < 0.01 vs. air-exposed controls and 5 ppm CO + isoflurane. D. Days to achieve criteria during reversal testing are demonstrated. *P < 0.05 vs. 100 ppm CO + isoflurane. †P < 0.01 vs. 100 ppm CO-exposed cohort. N = 14 animals per cohort.

