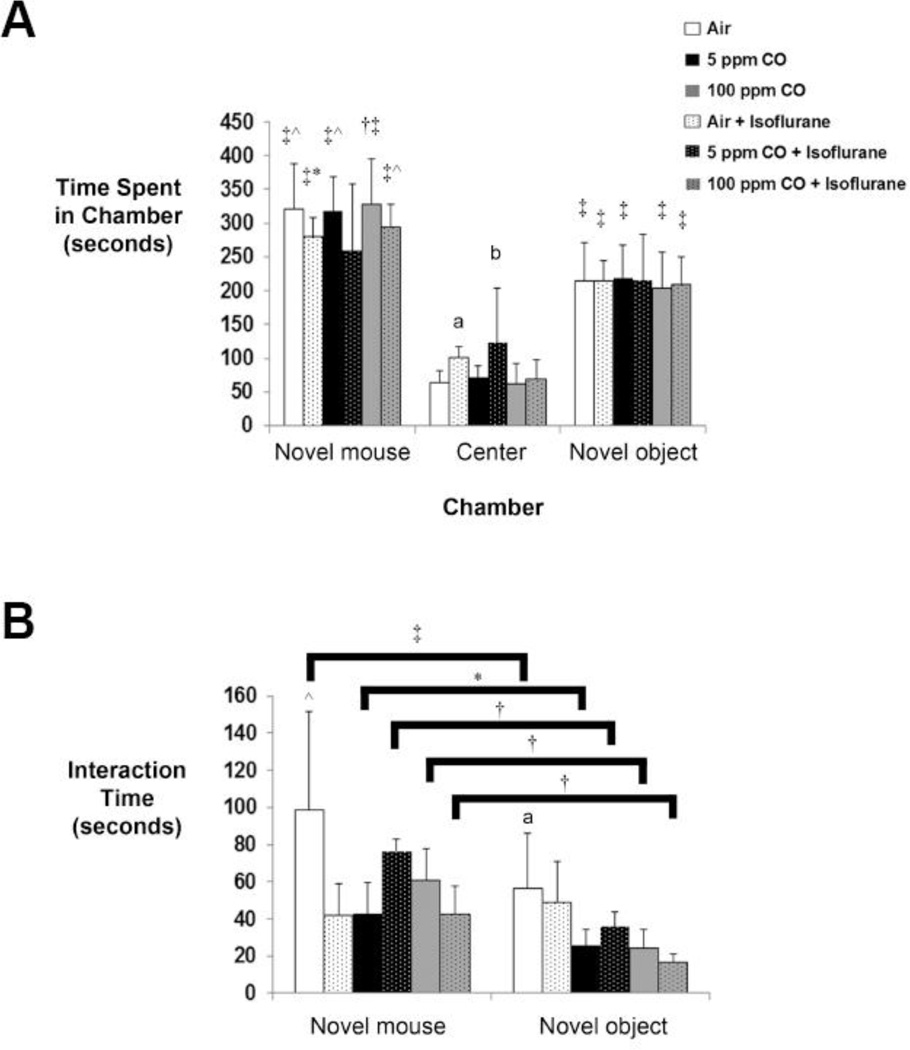
Figure 2. Social behavior following exposure.
A. Time spent in each chamber of the apparatus is depicted. The side chambers contained either the novel mouse or novel object while the center chamber lacked the presence of a stimulus mouse or inanimate object. Values from the six experimental cohorts are expressed as means plus standard deviation. *P < 0.05 vs. center chamber within the cohort. †P < 0.01 vs. novel object within the cohort. ‡P < 0.001 vs. center chamber within the cohort. ^P < 0.001 vs. novel object within the cohort. aP < 0.05 vs. air-exposed controls in center chamber, bP < 0.01 vs. air-exposed controls and P < 0.05 vs. 5 ppm CO-exposed and 100 ppm CO + isoflurane cohorts in center chamber. B. Interaction time with either the novel mouse or novel object is depicted. Values from the six experimental cohorts are expressed as means plus standard deviation. *P < 0.05 vs. novel object within the same cohort. †P < 0.01 vs. novel object within the same cohort. ‡P < 0.001 vs. novel object within the same cohort. ^P < 0.05 vs. air + isoflurane, 5 ppm CO-exposed, and 100 ppm CO + isoflurane cohorts with novel mouse. aP < 0.05 vs. 5 ppm CO-exposed, 100 ppm CO-exposed, and 100 ppm CO + isoflurane cohorts with novel object. N = 14 animals per cohort.

