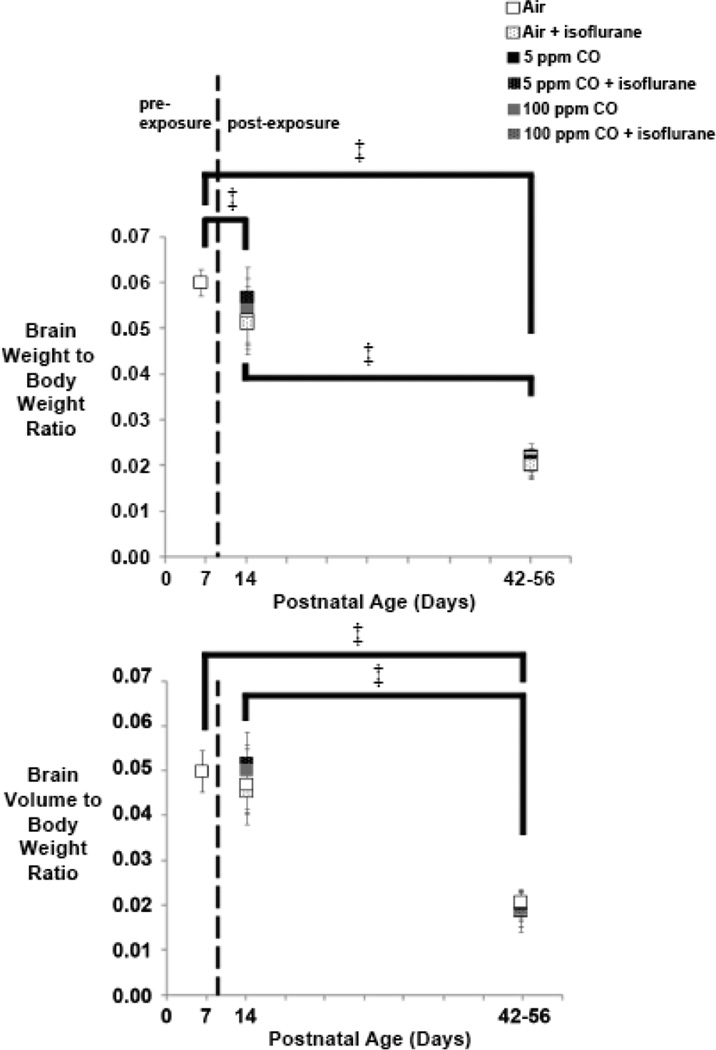
Figure 3. Normalized brain weight and volume following exposure.
Brain weight-to-body weight and brain volume-to-body weight ratios are depicted for each cohort 1-week (postnatal day 14) and 5–7 weeks (postnatal days 42–56) post exposure. Values for unexposed, naïve controls on postnatal day 7 are also shown. Dotted line separates pre- and post-exposed cohorts. N = 10 animals for each exposed cohort. N = 6 animals for unexposed controls. Values are expressed as means ± standard deviation. ‡ P < 0.001. Significance post-exposure was within exposure cohort only.

