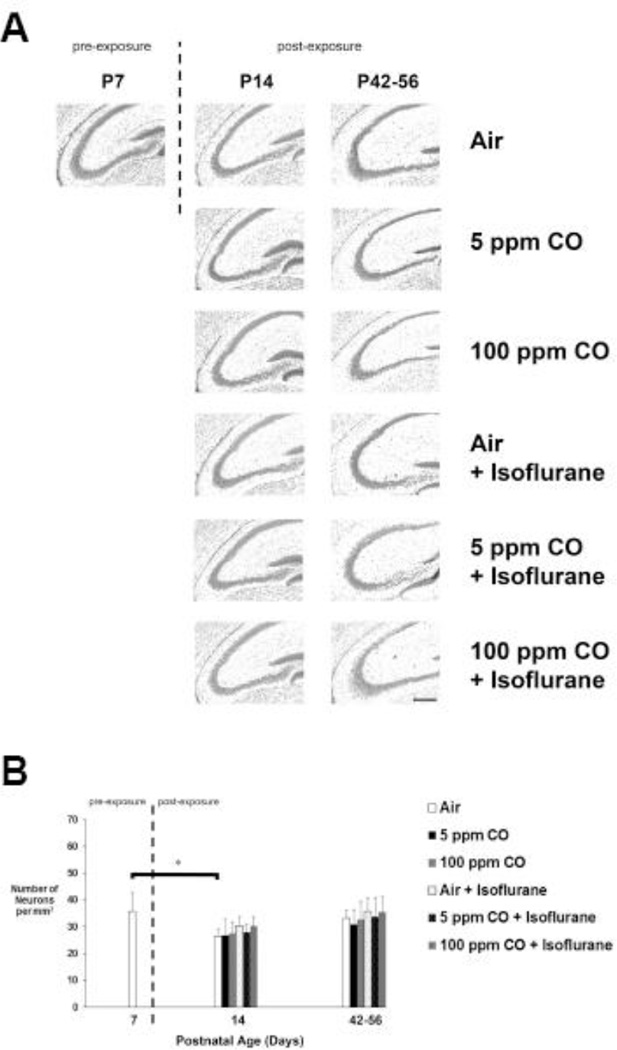
Figure 6. Estimated neuron density in CA3 region of hippocampus following exposure.
A. Representative cresyl violet stained coronal sections obtained at 20X magnification are depicted for each cohort 1-week (postnatal day 14) and 5–7 weeks (postnatal days 42–56) post exposure as well as for unexposed, naïve controls on postnatal day 7 (P7). Dotted line separates pre- and post-exposed cohorts. Scale bar, 200 µm. B. Quantification of the number of neurons (in thousands) in CA3 region is demonstrated. Values are expressed and means plus standard deviation. N = 4 animals per cohort per time point. *P < 0.001.

