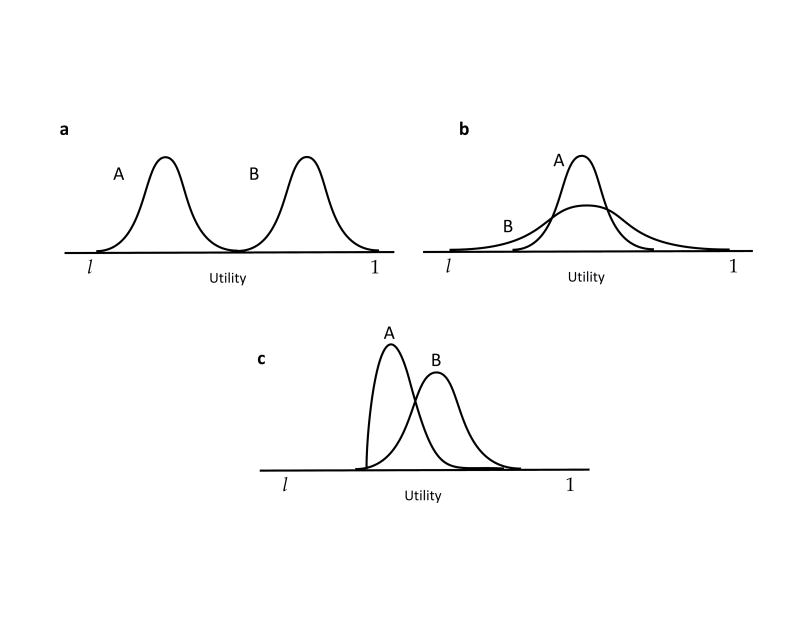
Figure 2.
Distributions of utility underlying hypothetical states of health. In a, B is simply a mean-shift of A. In b, A and B have the same mean, but different variances. In c, A and B have similar means and variances, but different skews. (Adapted from Fischhoff [44, Figure 2].)

