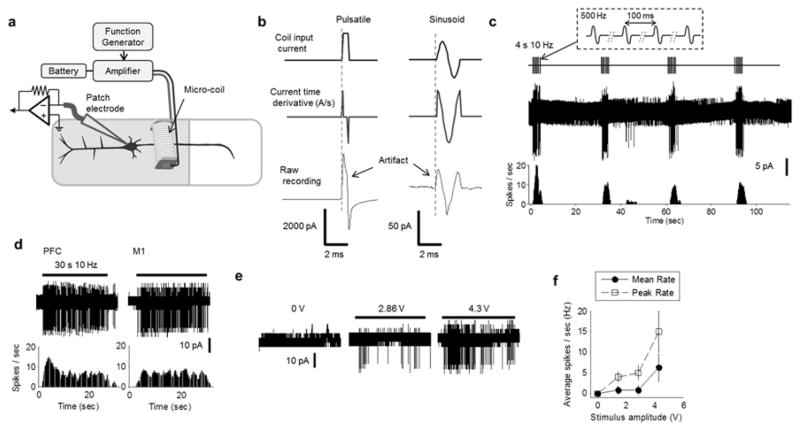
Fig. 2.
The proximal axon is sensitive to magnetic stimulation from a micro-coil. (a) Schematic of the experimental set-up: a patch electrode was used to record spiking from the soma of an L5 PN in response to stimulation from the micro-coil. The bottom edge of the coil was fixed 100 μm above the surface of the slice and the proximal edge (of the coil) was 100 μm from the soma. (b) Stimulation waveforms from pulsatile and sinusoid stimulation. Stimulus artifacts closely matched the time derivative of the coil input waveforms. (c) Responses to repetitive magnetic stimulation. (top) Stimuli consisted of single periods of a 500 Hz sinusoid (inset) delivered at a rate of 10 Hz for 4 s (40 total stimuli). This pattern was repeated every 30 s. (middle) Raw response from a typical L5 PN. (bottom) Corresponding PSTH (binsize = 0.1 s). (d) Responses to 10 Hz stimulation delivered for 30 s (300 total stimuli) from typical PFC and M1 PNs (left and right, respectively); horizontal bars at top indicate the timing of the stimulus. The corresponding PSTH is shown below each trace (binsize = 0.1 s). (e) Responses to different amplitudes of stimulation. Horizontal bars at top represent 10 Hz stimulation for 30 s; the amplitude of the stimulus (in Volts) is indicated above each bar. (f) Average spike rate of L5 PNs (PFC) as a function of stimulus amplitude. Error bars represent standard errors (S.E.; n=6).

