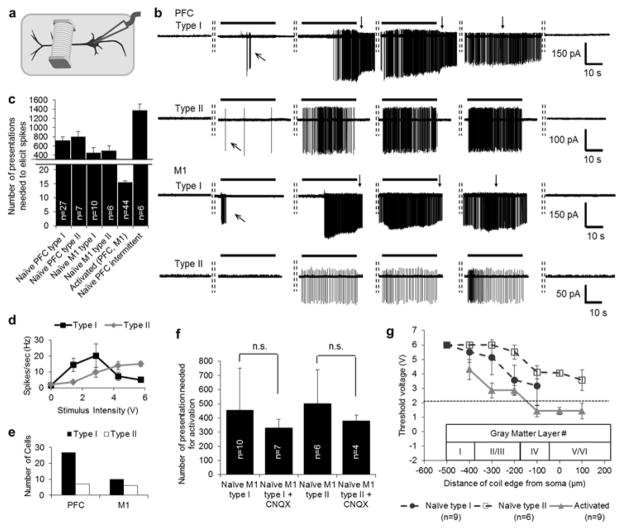
Fig. 4.
Stimulation of the apical dendrite activates L5 PNs. (a) Schematic indicating the coil positioned over the apical dendrite. (b) Responses to 10 Hz stimulation from a coil that was 100 μm from the soma; horizontal bars above each response represent a 30 s period during which stimulation was applied (300 total stimuli). Rows 1–2 are from PFC PNs and rows 3–4 from M1 PNs. Rows 1 & 3 are Type I PNs and rows 2 & 4 are Type II (see text). The dashed vertical lines between traces indicate 20 s intervals between consecutive periods of stimulation. Downward pointing arrows in rows 1 & 3 indicate periods of burst firing that persisted after the end of a stimulus train. Oblique arrows indicate transient spiking that sometimes occurred prior to the onset of continuous spiking. (c) Average number of presentations required to elicit spiking onset in different types of PNs; stimulus is repetitive 10 Hz, 30 s duration, 20 s interval for five left-most bars and 10 Hz, 4s duration, 26 s interval for right-most bar. Error bars represent S.E. (d) Average spike rate of the two types of PNs as a function of stimulus amplitude (type I, n=6; type II, n=5). (e) Distribution of the two types of PNs in PFC and M1 cortices. (f) Average numbers of presentations needed for activation of PNs in control vs. 10 μM CNQX. Unpaired t-test indicates the differences were not statistically significant (Type I: p=0.29; Type II: p=0.36). Error bars indicate standard deviation (±S.D.). (g) Mean thresholds to elicit spikes as a function of the distance between the soma and the closest edge of the coil to the soma (all locations over the apical dendrite). Coil height was fixed at 100 μm above the slice surface. Stimulation was 10 Hz for 30 s. Dark filled circles: naïve type I PNs; open squares: naïve type II; shaded triangles: activated PNs. Bars represent S.E. Data points at 6 V indicate the threshold exceeded the upper limit of the stimulus system. The dashed horizontal line indicates the minimum threshold for stimulation over the axon (cf. Fig. 3a).

