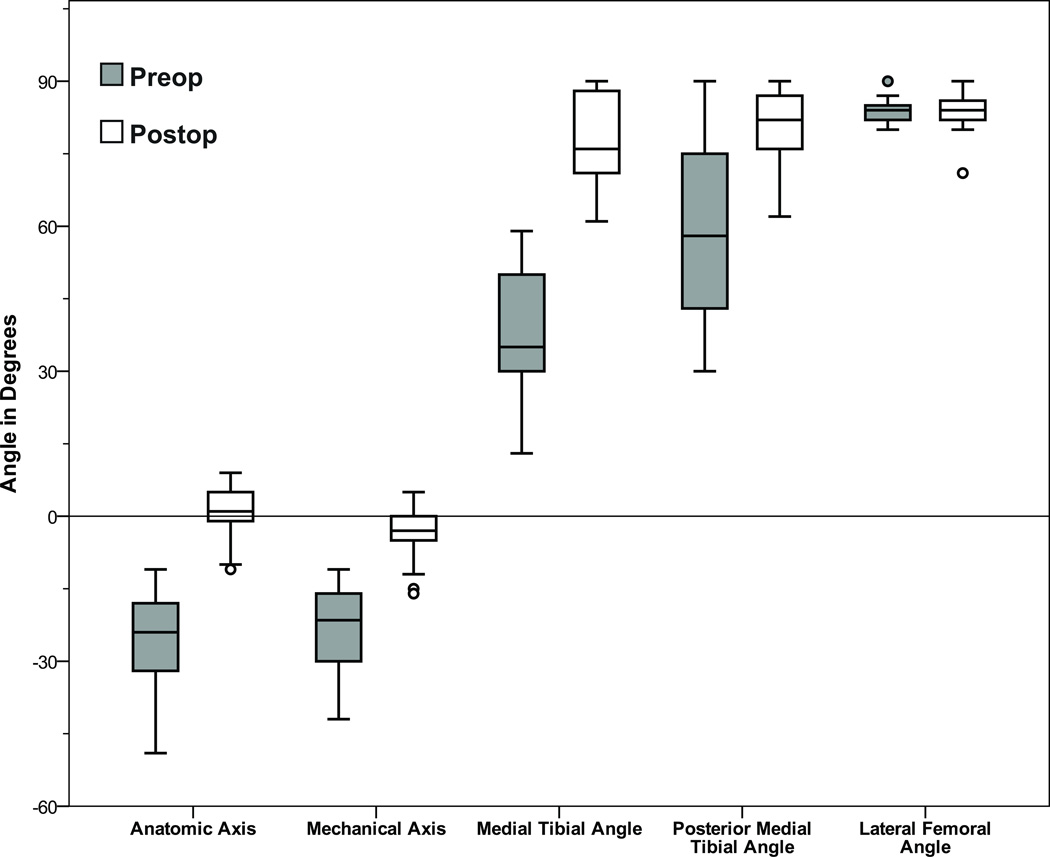
Fig. 3.
Box and whisker plot used to show the preoperative and postoperative radiographic measurements. The median value is represented by the line within the vertical box. The box spans from the 25th to the 75th percentile. Minor and extreme outliers are denoted by circles and stars, respectively. Negative values indicate varus. Note with the exception of the lateral femoral angle results there was significant correction radiographically of the remaining deformities (p<0.001).

