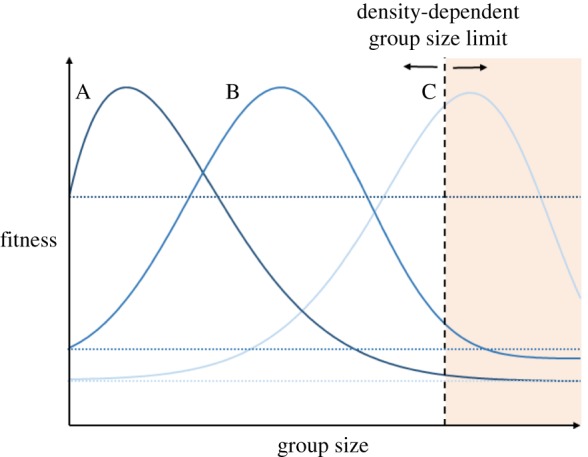
Figure 3.

Theoretical representation of changes in fitness with group size for individuals with different energetic demands and physiological capacities for maximum levels of aerobic metabolism. Each peak represents the point at which fitness is optimized: foraging efficiency (locating foraging patches) and predator avoidance quickly increase but returns diminish as group size grows. Simultaneously, the costs of grouping increase exponentially with group size due to competition among group-mates for available food sources. Curve A represents a high-performance individual with a high maximum metabolic rate, which allows a high locomotor performance but a correspondingly high baseline metabolic rate to support this capacity. For this individual, fitness should be higher at lower group sizes due to a decreased requirement for the anti-predator benefits of grouping and an increased need to secure food. Alternatively, curve C represents a low-performance individual with a low metabolic demand. This individual should prioritize safety over foraging, due to decreased locomotor abilities and a reduced need for food. Curve B represents an intermediate individual. Dotted horizontal lines represent fitness of each individual when they are without group-mates (i.e. the y-intercept of each curve when group size is equal to 1). The elevation of this intercept and the curves for each phenotype will be modulated by environmental conditions. For example, under conditions of low food availability, fitness of the high-performance phenotype would theoretically go down and the fitness of the low-performance individual would go up. The dashed horizontal line represents a population-level cap on group sizes that is expected to occur due to population density. At very low population densities, low-performance phenotypes may be unable to achieve group sizes that would maximize their fitness.
