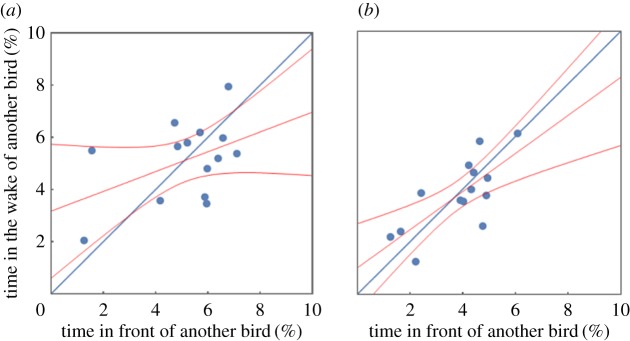
Figure 4.
(a) Percentage of time of the human guided flights that birds were in the wake area 0–3 m behind and 1.0–1.55 m lateral to another bird (corresponding to a wing tip spacing of −0.2 to 0.35 m) plotted against the percentage of time the same birds were trailed by another bird positioned in the in-wake area. Red lines: fit of a linear regression model and the corresponding 95% confidence interval. The blue line visualizes expected values for perfect reciprocation. (b) Percentage of time that birds were in the wake area of another bird plotted against the percentage of time another bird followed in their wake area during the independent flight phase of leg 4.

