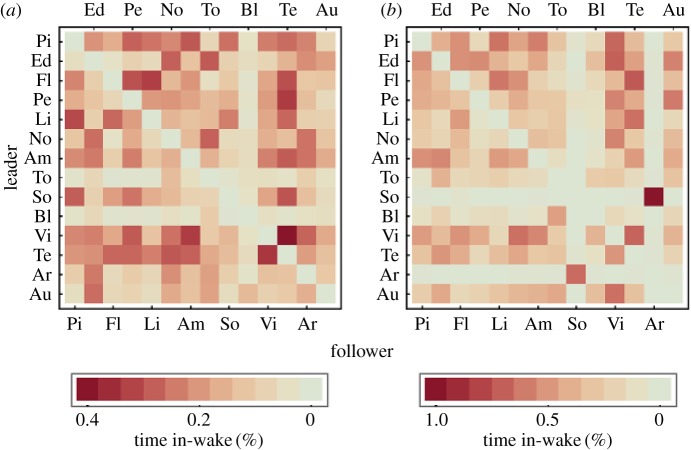
Figure 5.
(a) Percentage of time of the human guided flights that specific birds were in the wake area 0–3 m behind and 1.0–1.55 m lateral to a specific bird plotted for each bird of the flock. (b) Percentage of time of the independent flight that specific birds were in the wake area 0–3 m behind and 1.0–1.55 m lateral to a specific bird.

